Bitcoin price is up a robust 8.5% from the July low of $32,700, recorded both on Thursday and Friday. The coin surged over $3K over the past two days, breaking above the 20-day moving average line at $34.9K, and is now facing a combination of significant resistance on the daily timeframe.
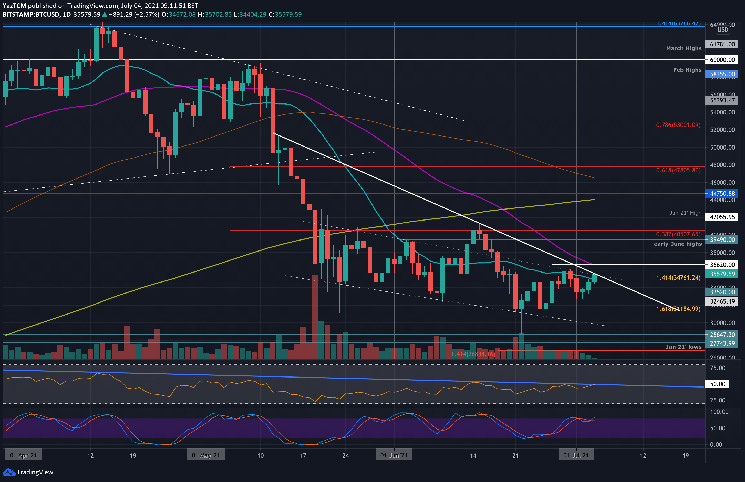
The major resistance is provided by a falling trend-line that dates back to mid-May when Bitcoin was trading above $50K. This line forms the upper angle of a potential descending triangle pattern, with an apex expected in around 10 days, whereas the triangle floor at around $31K (the level where BTC found support for 5 (!) times already since first retesting it on May 19, 2021).
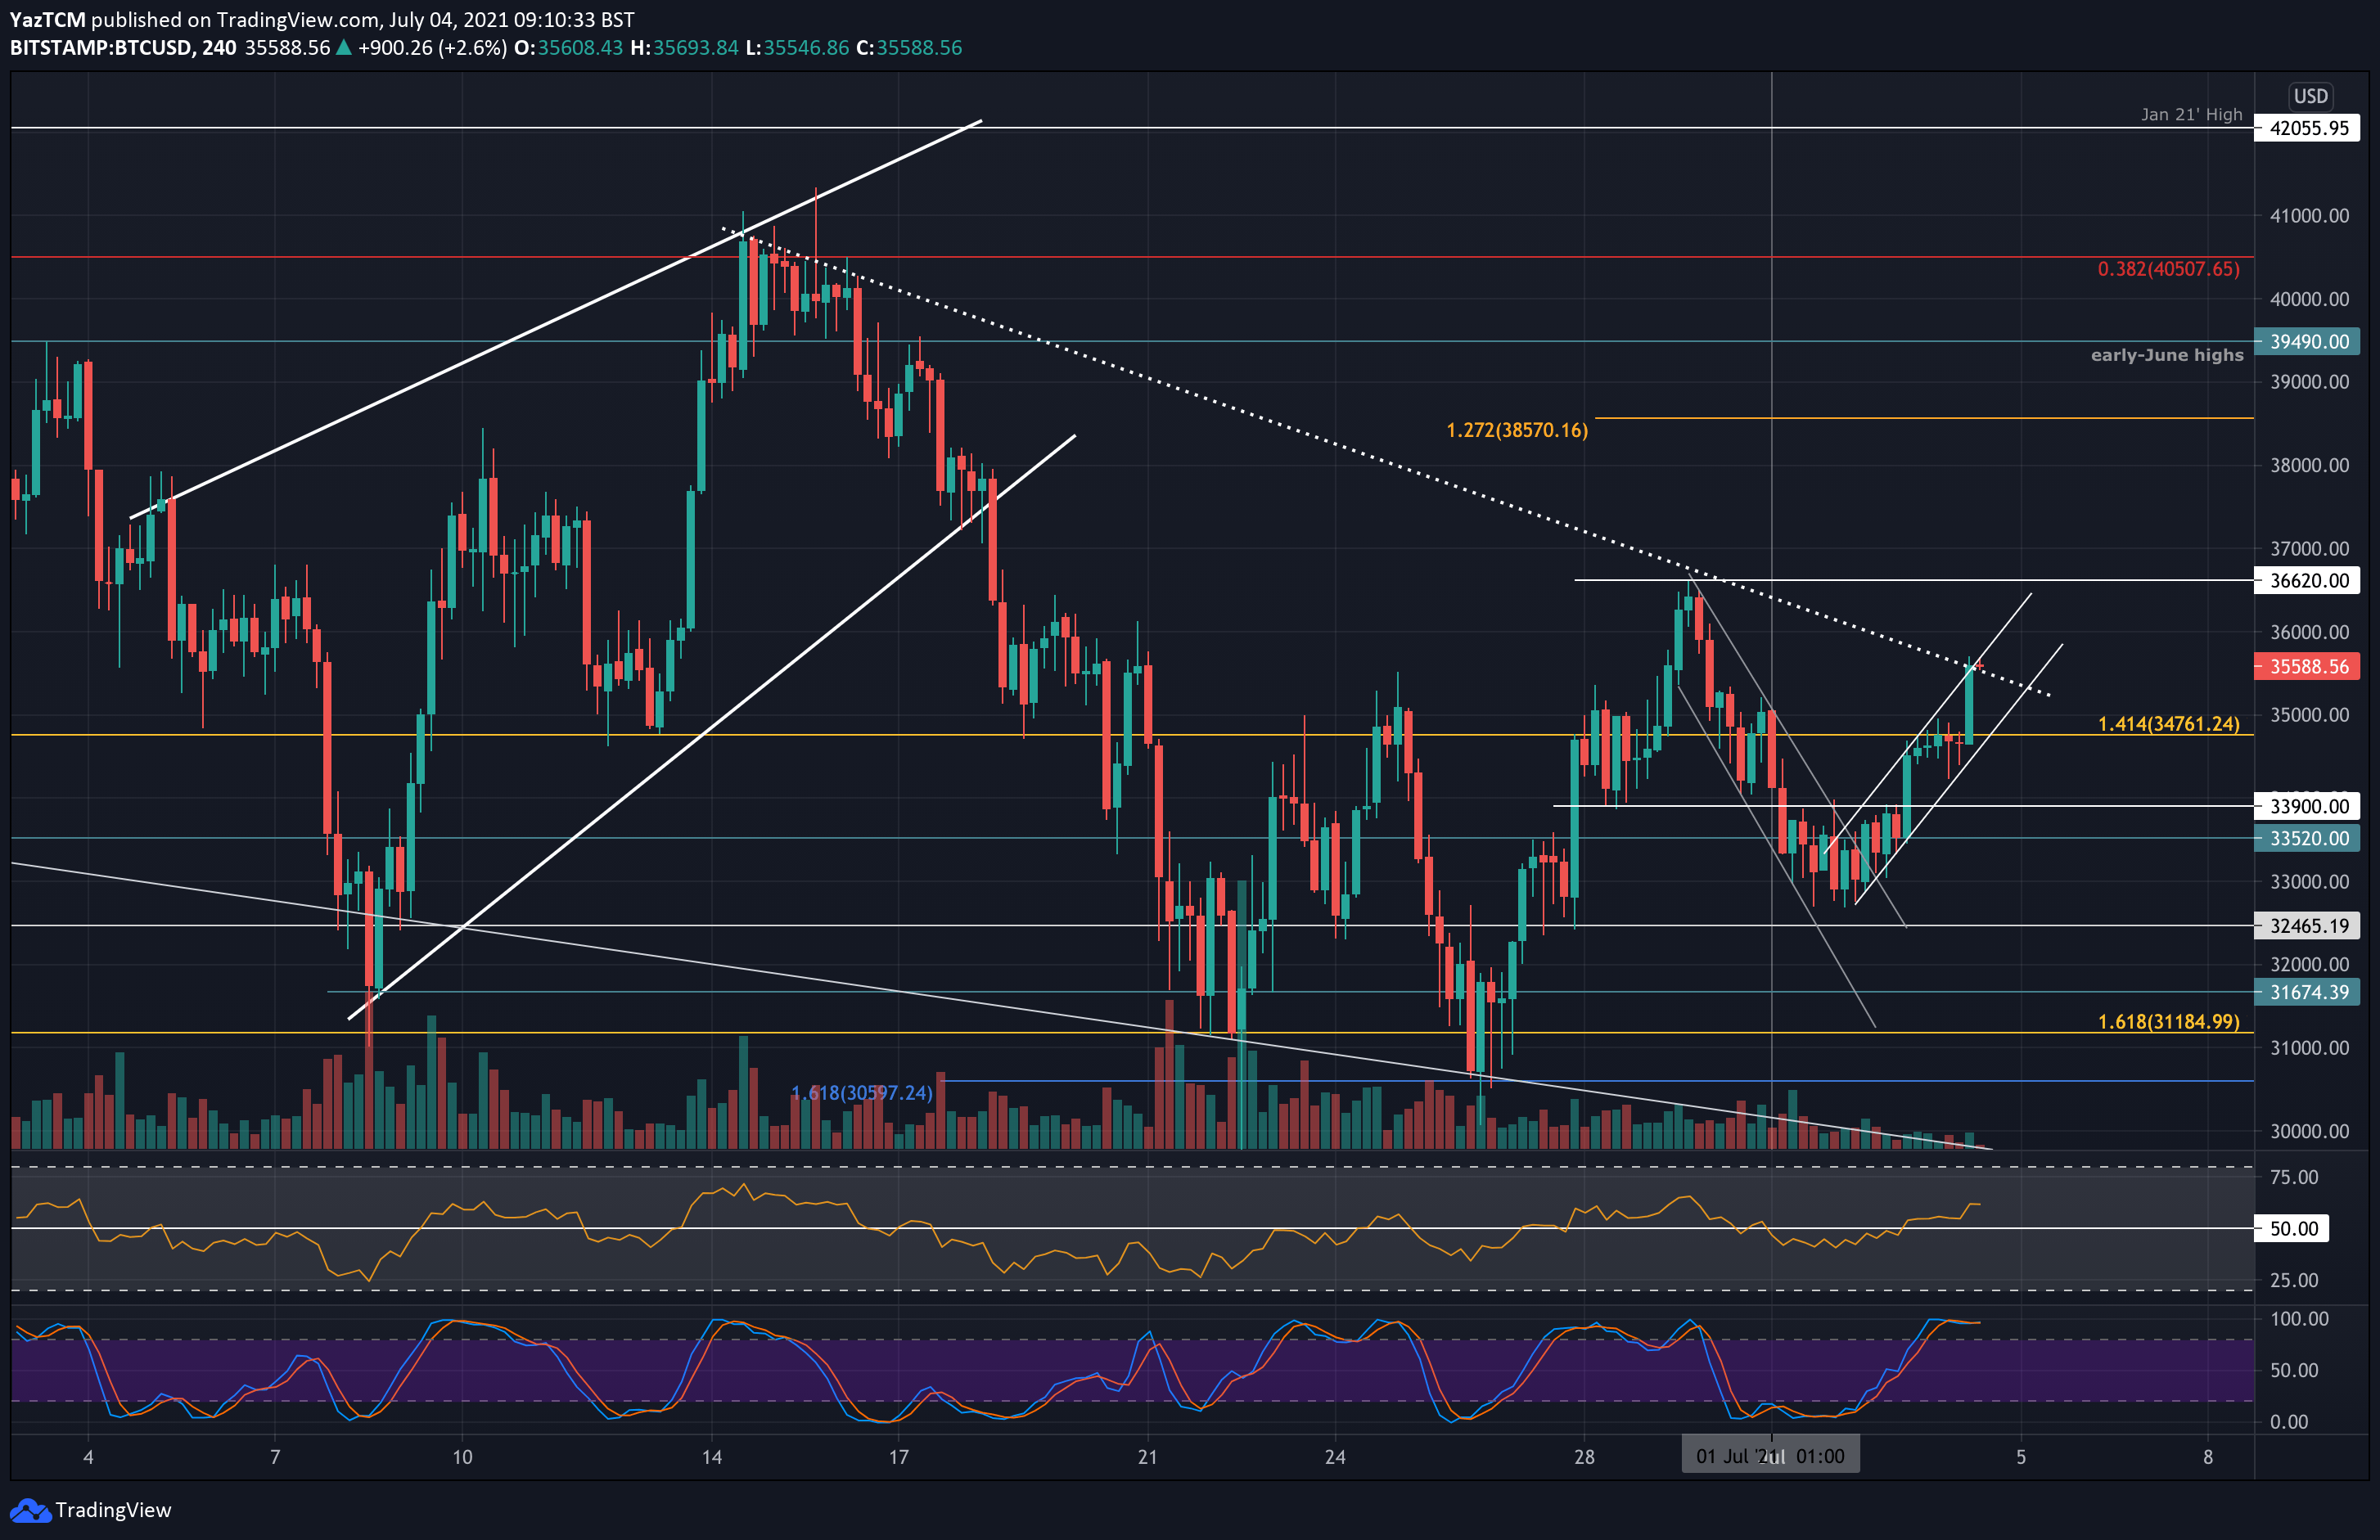
Looking at the shorter timeframe, bitcoin price was trading inside a descending price channel since hitting the weekly high at $36,620 on Tuesday and, as mentioned, found a double-bottom support around $32,700 on both days – Thursday and Friday.
Then, it managed to break above the descending price channel on Friday and started to form a short-term ascending price channel over the weekend. Earlier today, BTC surged and broke resistance around $34,760, combined with the MA-20, as it reached as high as $35,700, reaching resistance at the upper angle of the mentioned above price channel.
In conclusion, the formation is starting to look slightly promising for Bitcoin. However, the cryptocurrency must overcome the major resistance area at $35-36K which includes the MA-20 (~$34.9K), mid-term descending trend-line, and the MA-50 (~$36.6K, same as last week’s high). In addition, the daily RSI is also at a critical level – retesting a descending trend-line of lower highs – which started forming in February 2021.
As always – Bitcoin is trading inside a range of $30K to $42K since mid-May and will need to break above $42K to return to the bullish track.
BTC Price Support and Resistance Levels to Watch
Key Support Levels: $34.9-35K, $33,900, $33.5K, $32,700, $31,675.
Key Resistance Levels: $36,620, $38,000, $38,570, $39,490, $40,500.
If the buyers break the combined $35,700 resistance and head above $36,000, the first strong resistance lies at $36,620, provided by the late-June highs and the 50-day MA. This is followed by $38,000, $38,570 (1.272 Fib Extension), $39,490 (early-June highs), and $40,500 (bearish .382 Fib). Strong resistance then lies at $42K (Jan 2021 highs).
On the other side, the first support lies at $34.9-35K (20-day MA & lower angle of the short-term price channel). Beneath this, support is found at $33,900, $33.5K, $32,700 (July’s low), and $31,675.
The daily RSI has returned to the long-term descending trend line we have been following here lately. This will be a critical level for the momentum to break as it has prevented it from creating higher highs since late February. The short-term momentum recently climbed above the midline for the first time in July, indicating the buyers are attempting to establish some ground.
Bitstamp BTC/USD Daily Chart
Bitstamp BTC/USD 4-Hour Chart