Bitcoin (BTC) has fallen considerably since its April 14 all-time high price. It’s likely correcting in a long-term wave four. However, the exact short-term wave count cannot be confidently determined.
Bullish bitcoin count
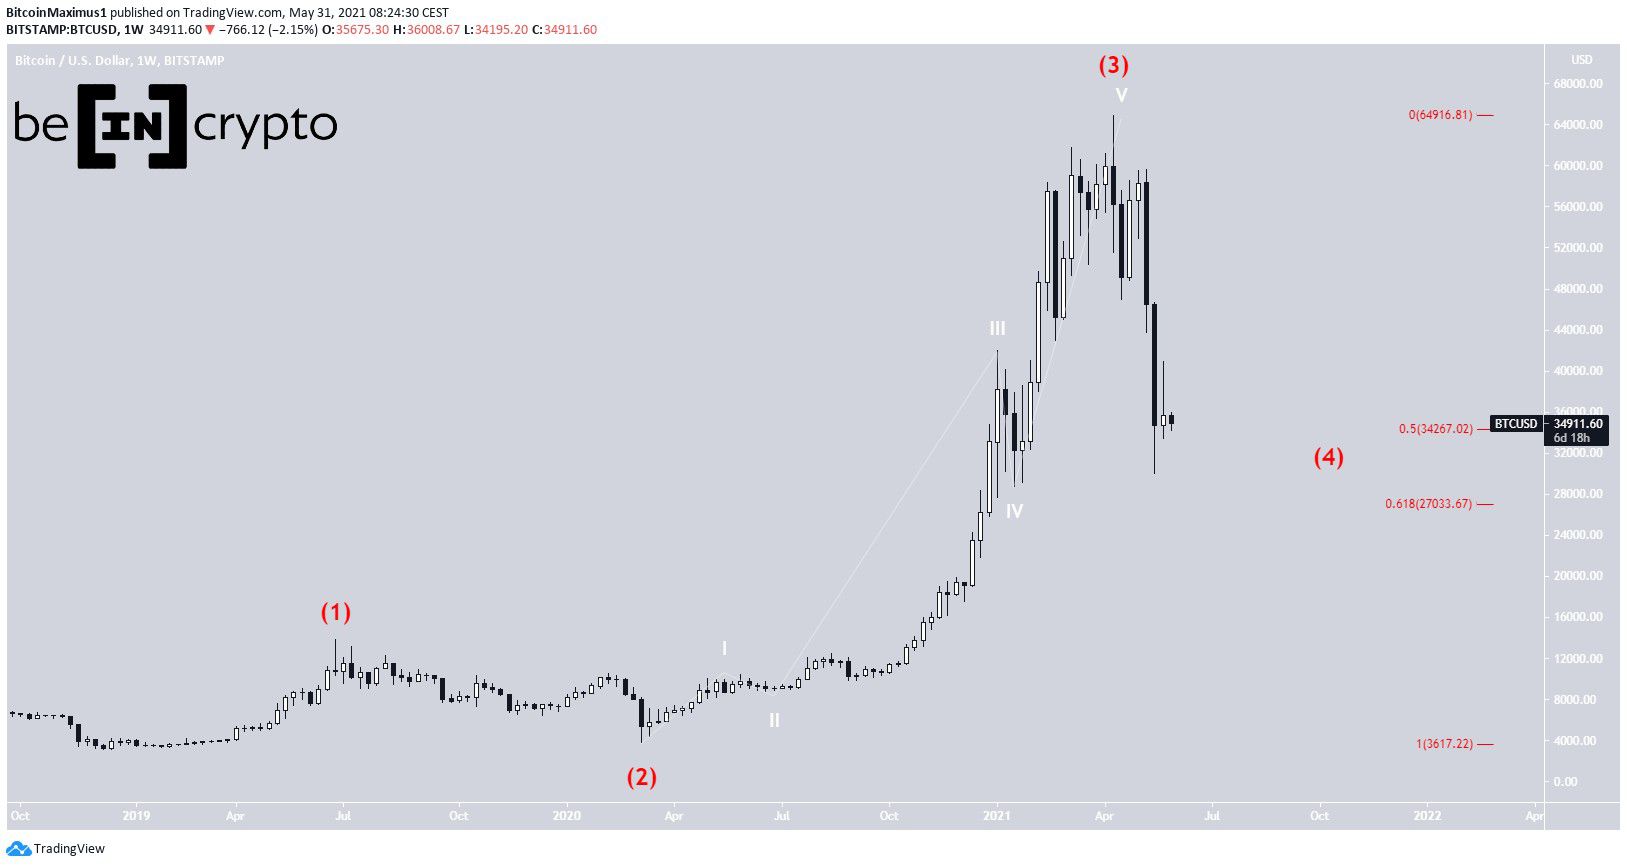
BTC has been moving downwards since reaching an all-time high price of $64,895 on April 14, 2021. The drop has been sharp, further accelerating on May 19.
So far, a local low of $30,000 was reached on May 26.
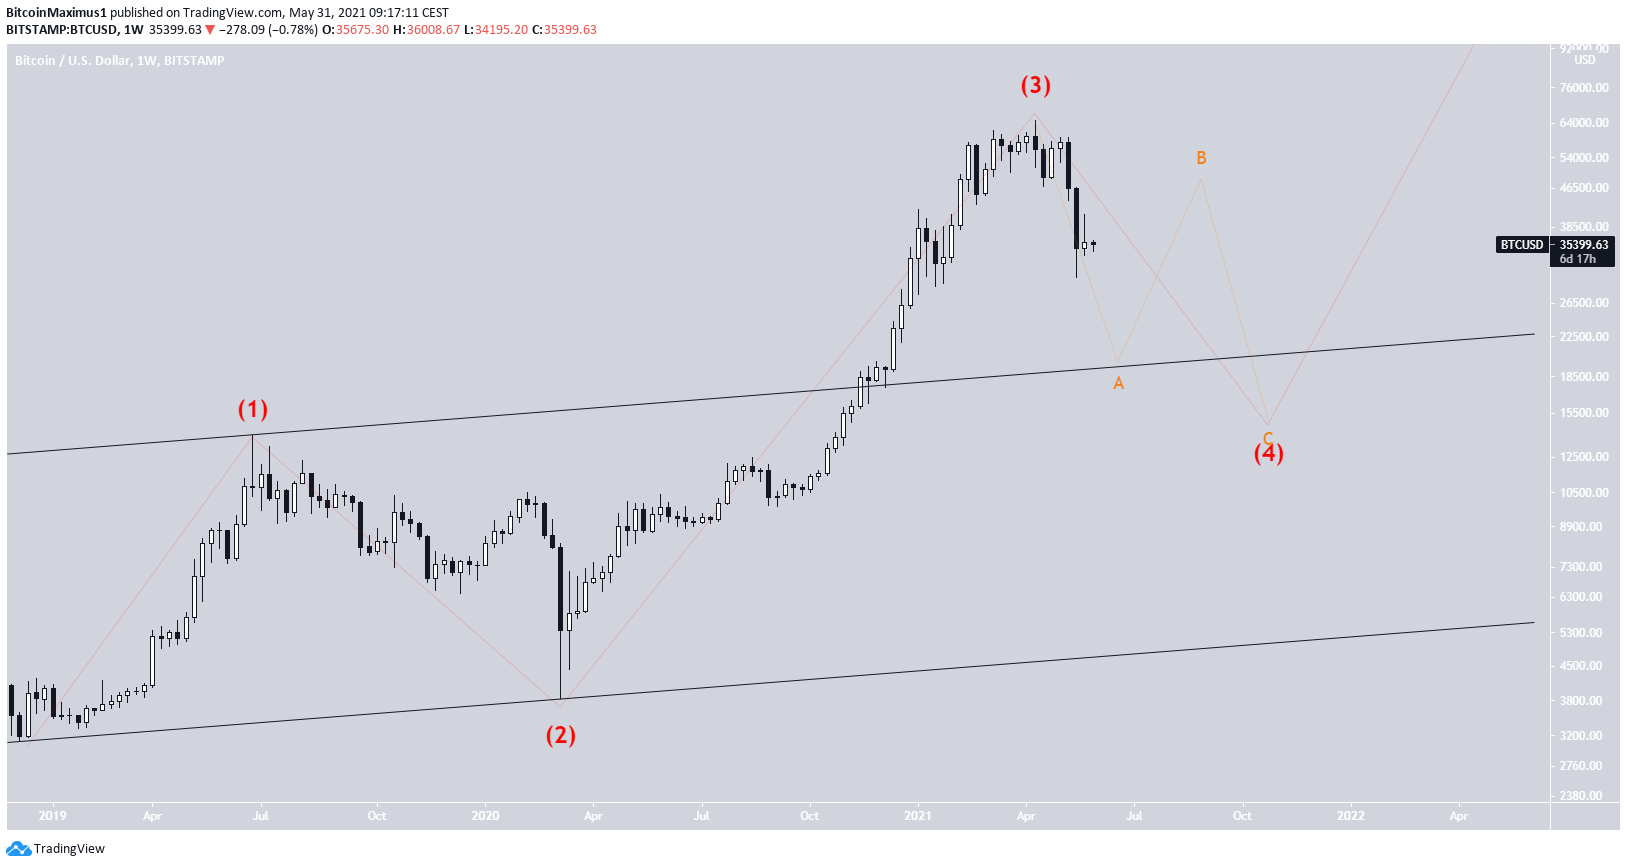
The most likely count indicates that this is wave four of a bullish impulse that began in December 2018. This is because of very similar readings in long-term indicators between the corrective waves two and four.
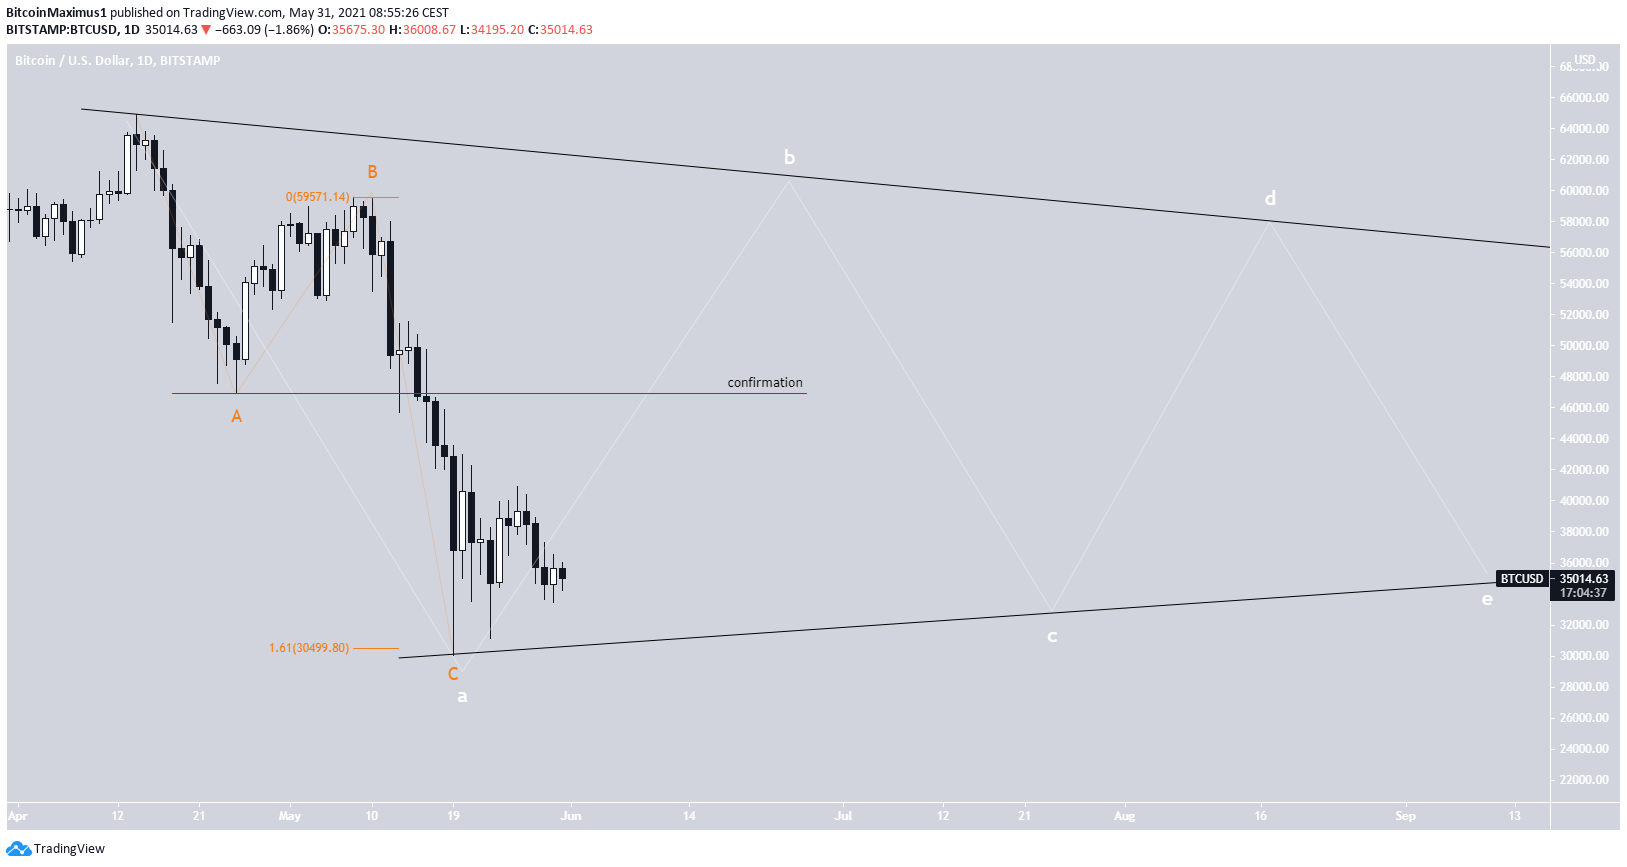
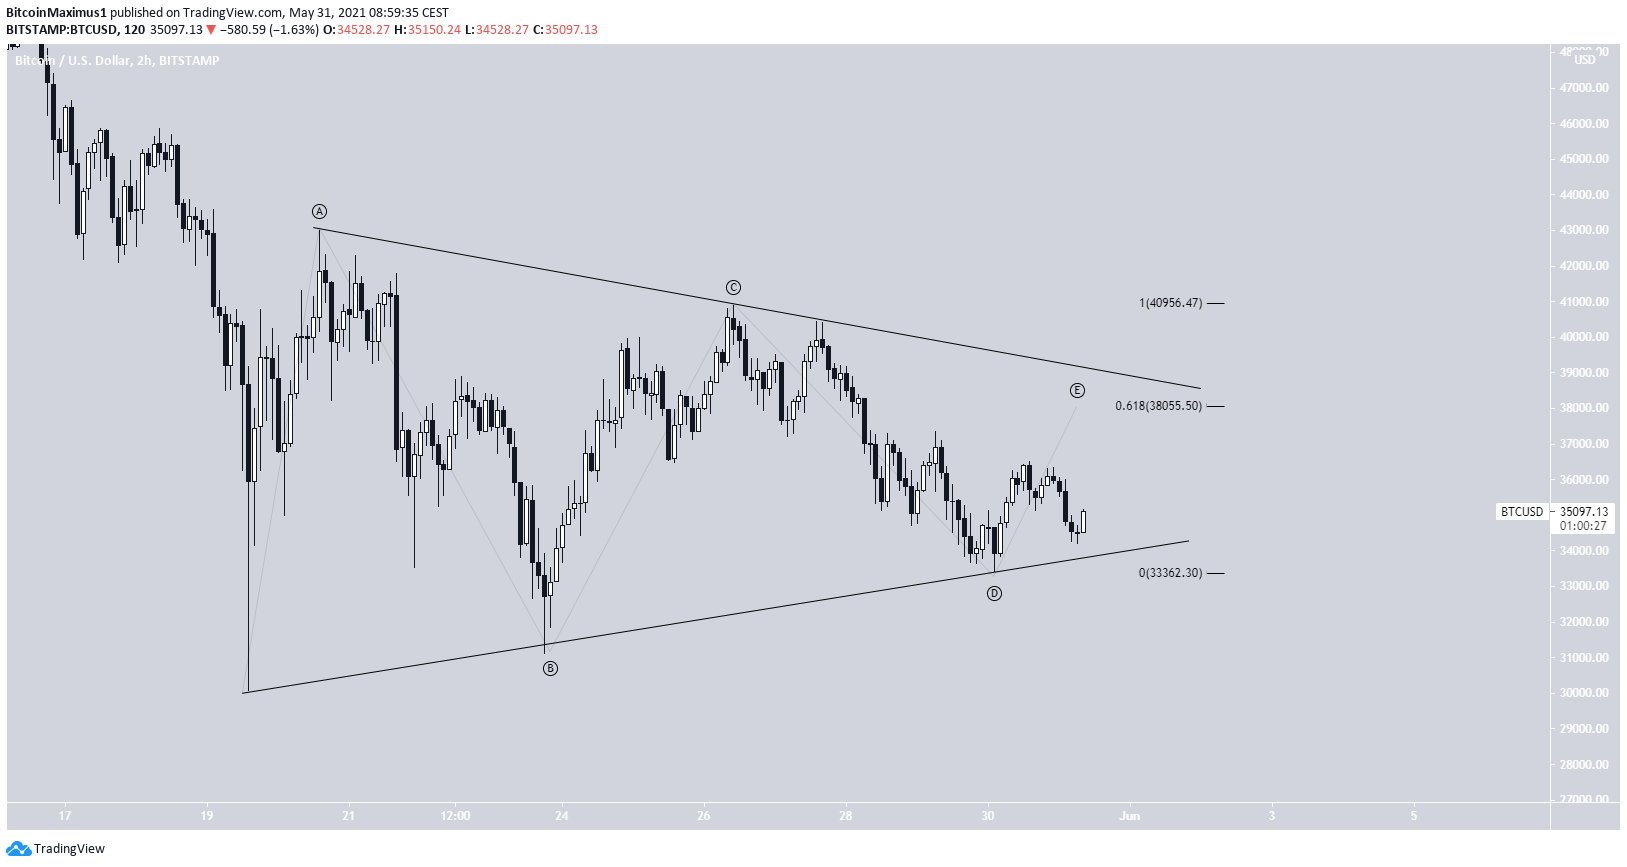
If correct, the most likely possibility would be that wave four would take the shape of a symmetrical triangle. This would put BTC in the B sub-wave (white), meaning that it will likely increase toward the resistance line of the triangle.
The minor sub-wave count is shown in orange. In it, minor sub-waves A:C have a 1:1.61 ratio, common in such corrections.
A movement above the minor sub-wave A low at $47,000 would confirm that this is not a bearish impulse but rather a correction, confirming the triangle pattern possibility.
Bearish BTC count
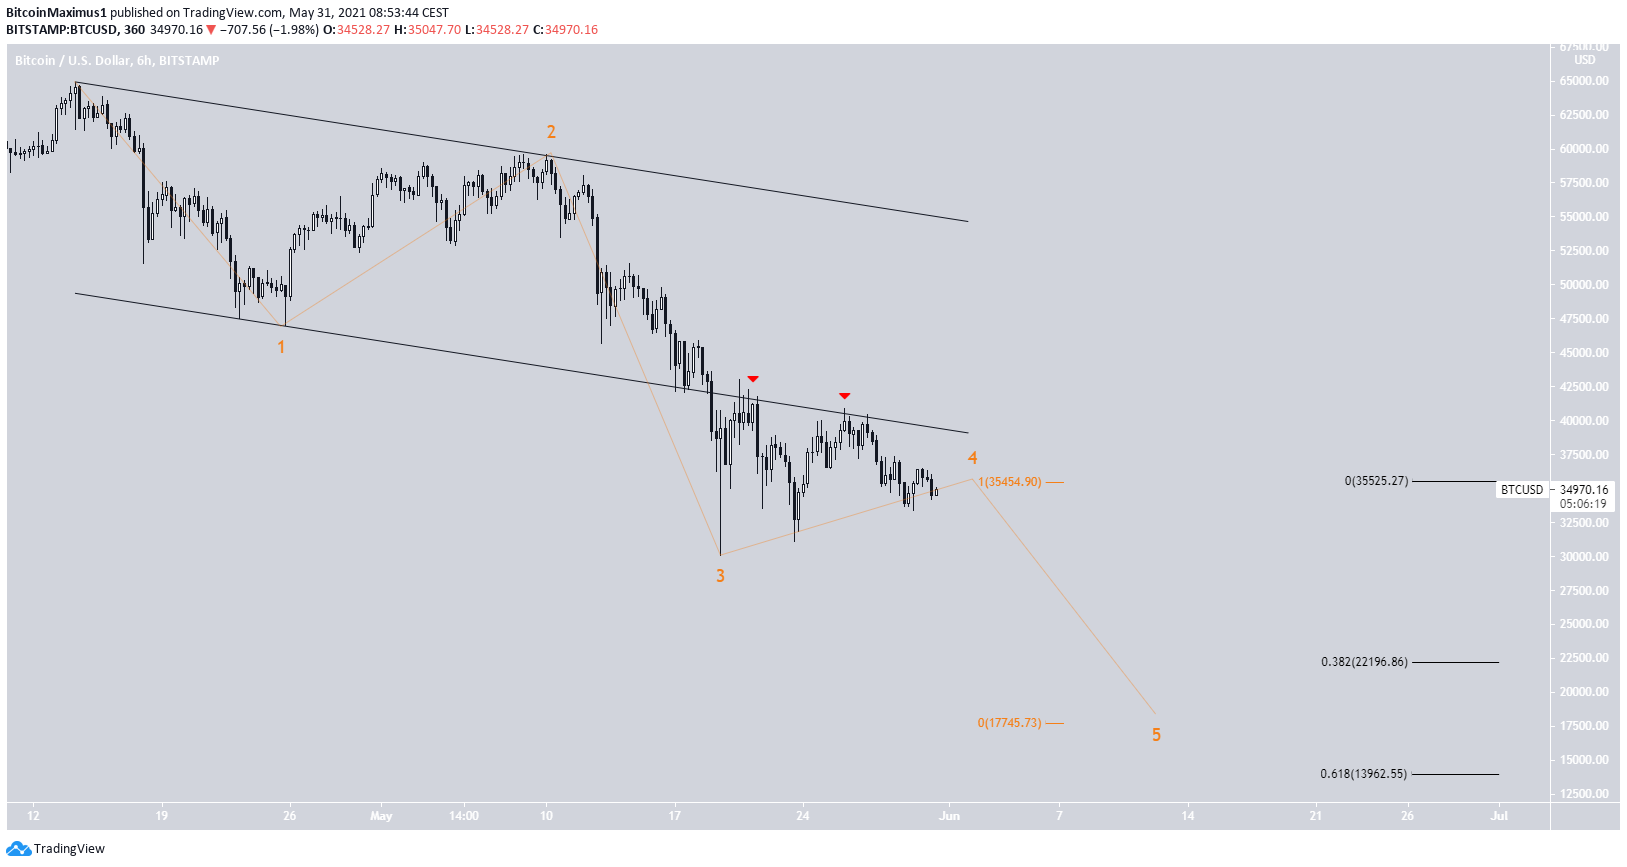
Cryptocurrency trader @Thetradinghubb outlined a BTC chart that shows a short-term fourth wave triangle. They indicate that a breakdown is most likely.
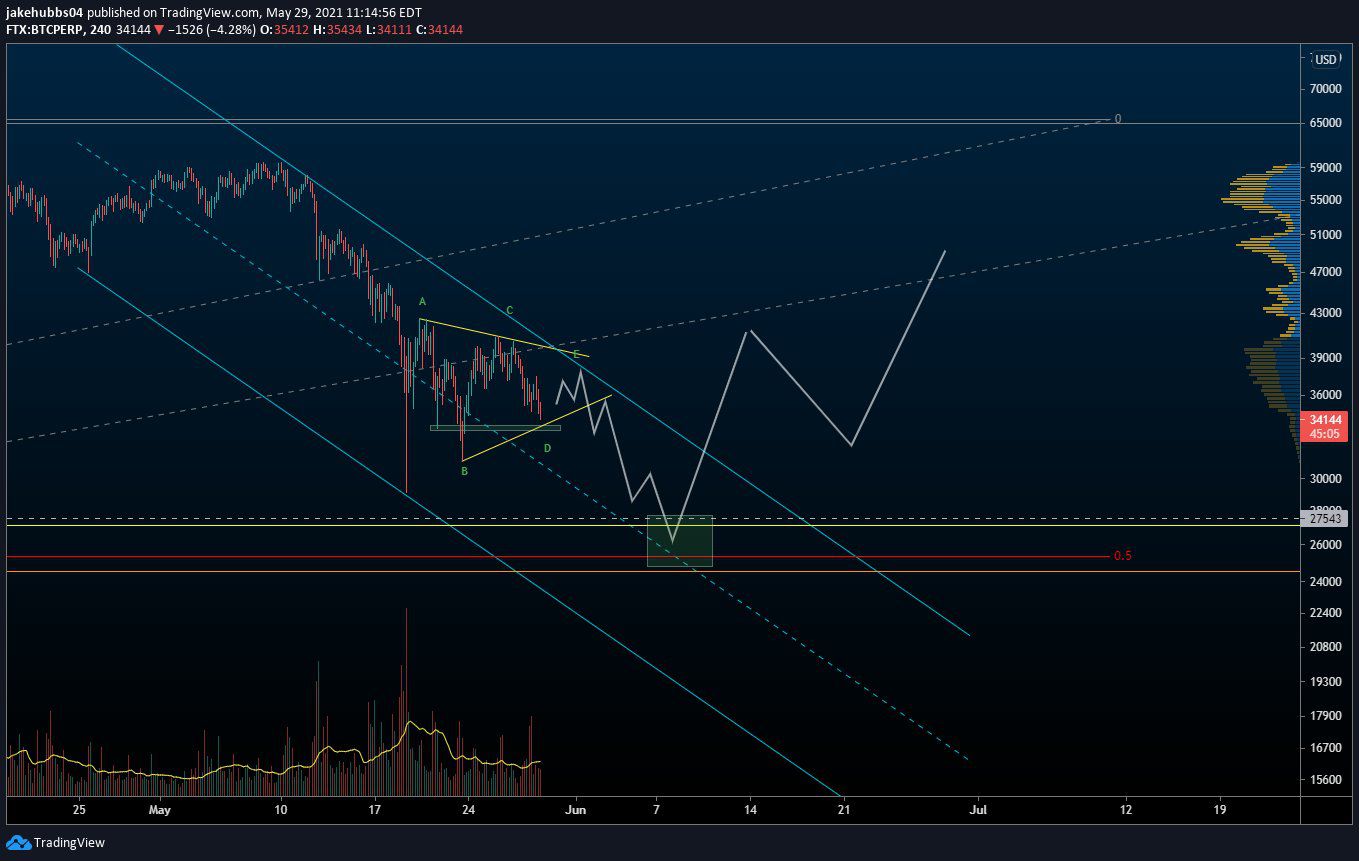
The proposed count indicates that the current movement is a symmetrical triangle.
Since triangles are usually contained inside wave four, it would mean that this is potentially wave four of a bearish impulse. Another increase towards the resistance line would be likely before the eventual breakdown.
If so, this would mean that a bearish impulse (orange) began after the aforementioned April 14 all-time high. In it, BTC is currently in wave four.
The price movement somewhat fits with this possibility. BTC has broken down from a descending parallel channel and validated it as resistance (red icons) in a potential fourth wave pullback.
Potential targets for the bottom of this movement are found at $22,000, $17,700, and $14,000. In terms of the sharpness of the decrease without a bounce, the fall would be historically unprecedented.
If BTC does not reclaim the channel, this bearish scenario would be a likely possibility.
Since it’s a bearish impulse, the movement would be wave A in an A-B-C corrective structure (orange), in order to complete wave four (red) and a potential fourth wave pullback.
While this is technically valid, due to the sharpness of this correction relative to the previous ones and the bullish readings from daily indicators, this does not seem likely.