Bitcoin is ending today (Sunday) a second bloody week, which could probably turn into the worst-ever week for the primary cryptocurrency if we measure it dollar-wise.
On May 10, just 13 days ago, the price was trading at nearly $60K. This week’s low from Wednesday lies slightly above $30K, according to Bitstamp. A 50% decrease in 13 days, and 54% below the ATH level of around $65K recorded on April 14.
As mentioned, the severe drop occurred on Wednesday when BTC slipped beneath the significant support of the January 2021 highs of around $42,000. In a matter of hours, BTC plunged to as low as $30,000. Fortunately, the bulls regrouped from this crash quickly to allow the daily candle to close at support around $36,750, provided by a .786 Fib Retracement, and just a day after BTC was retesting $42K as resistance.
However, the bitcoin bloodbath continues on Friday following another China ban FUD reports.
Bloodbath Continues To The Weekend
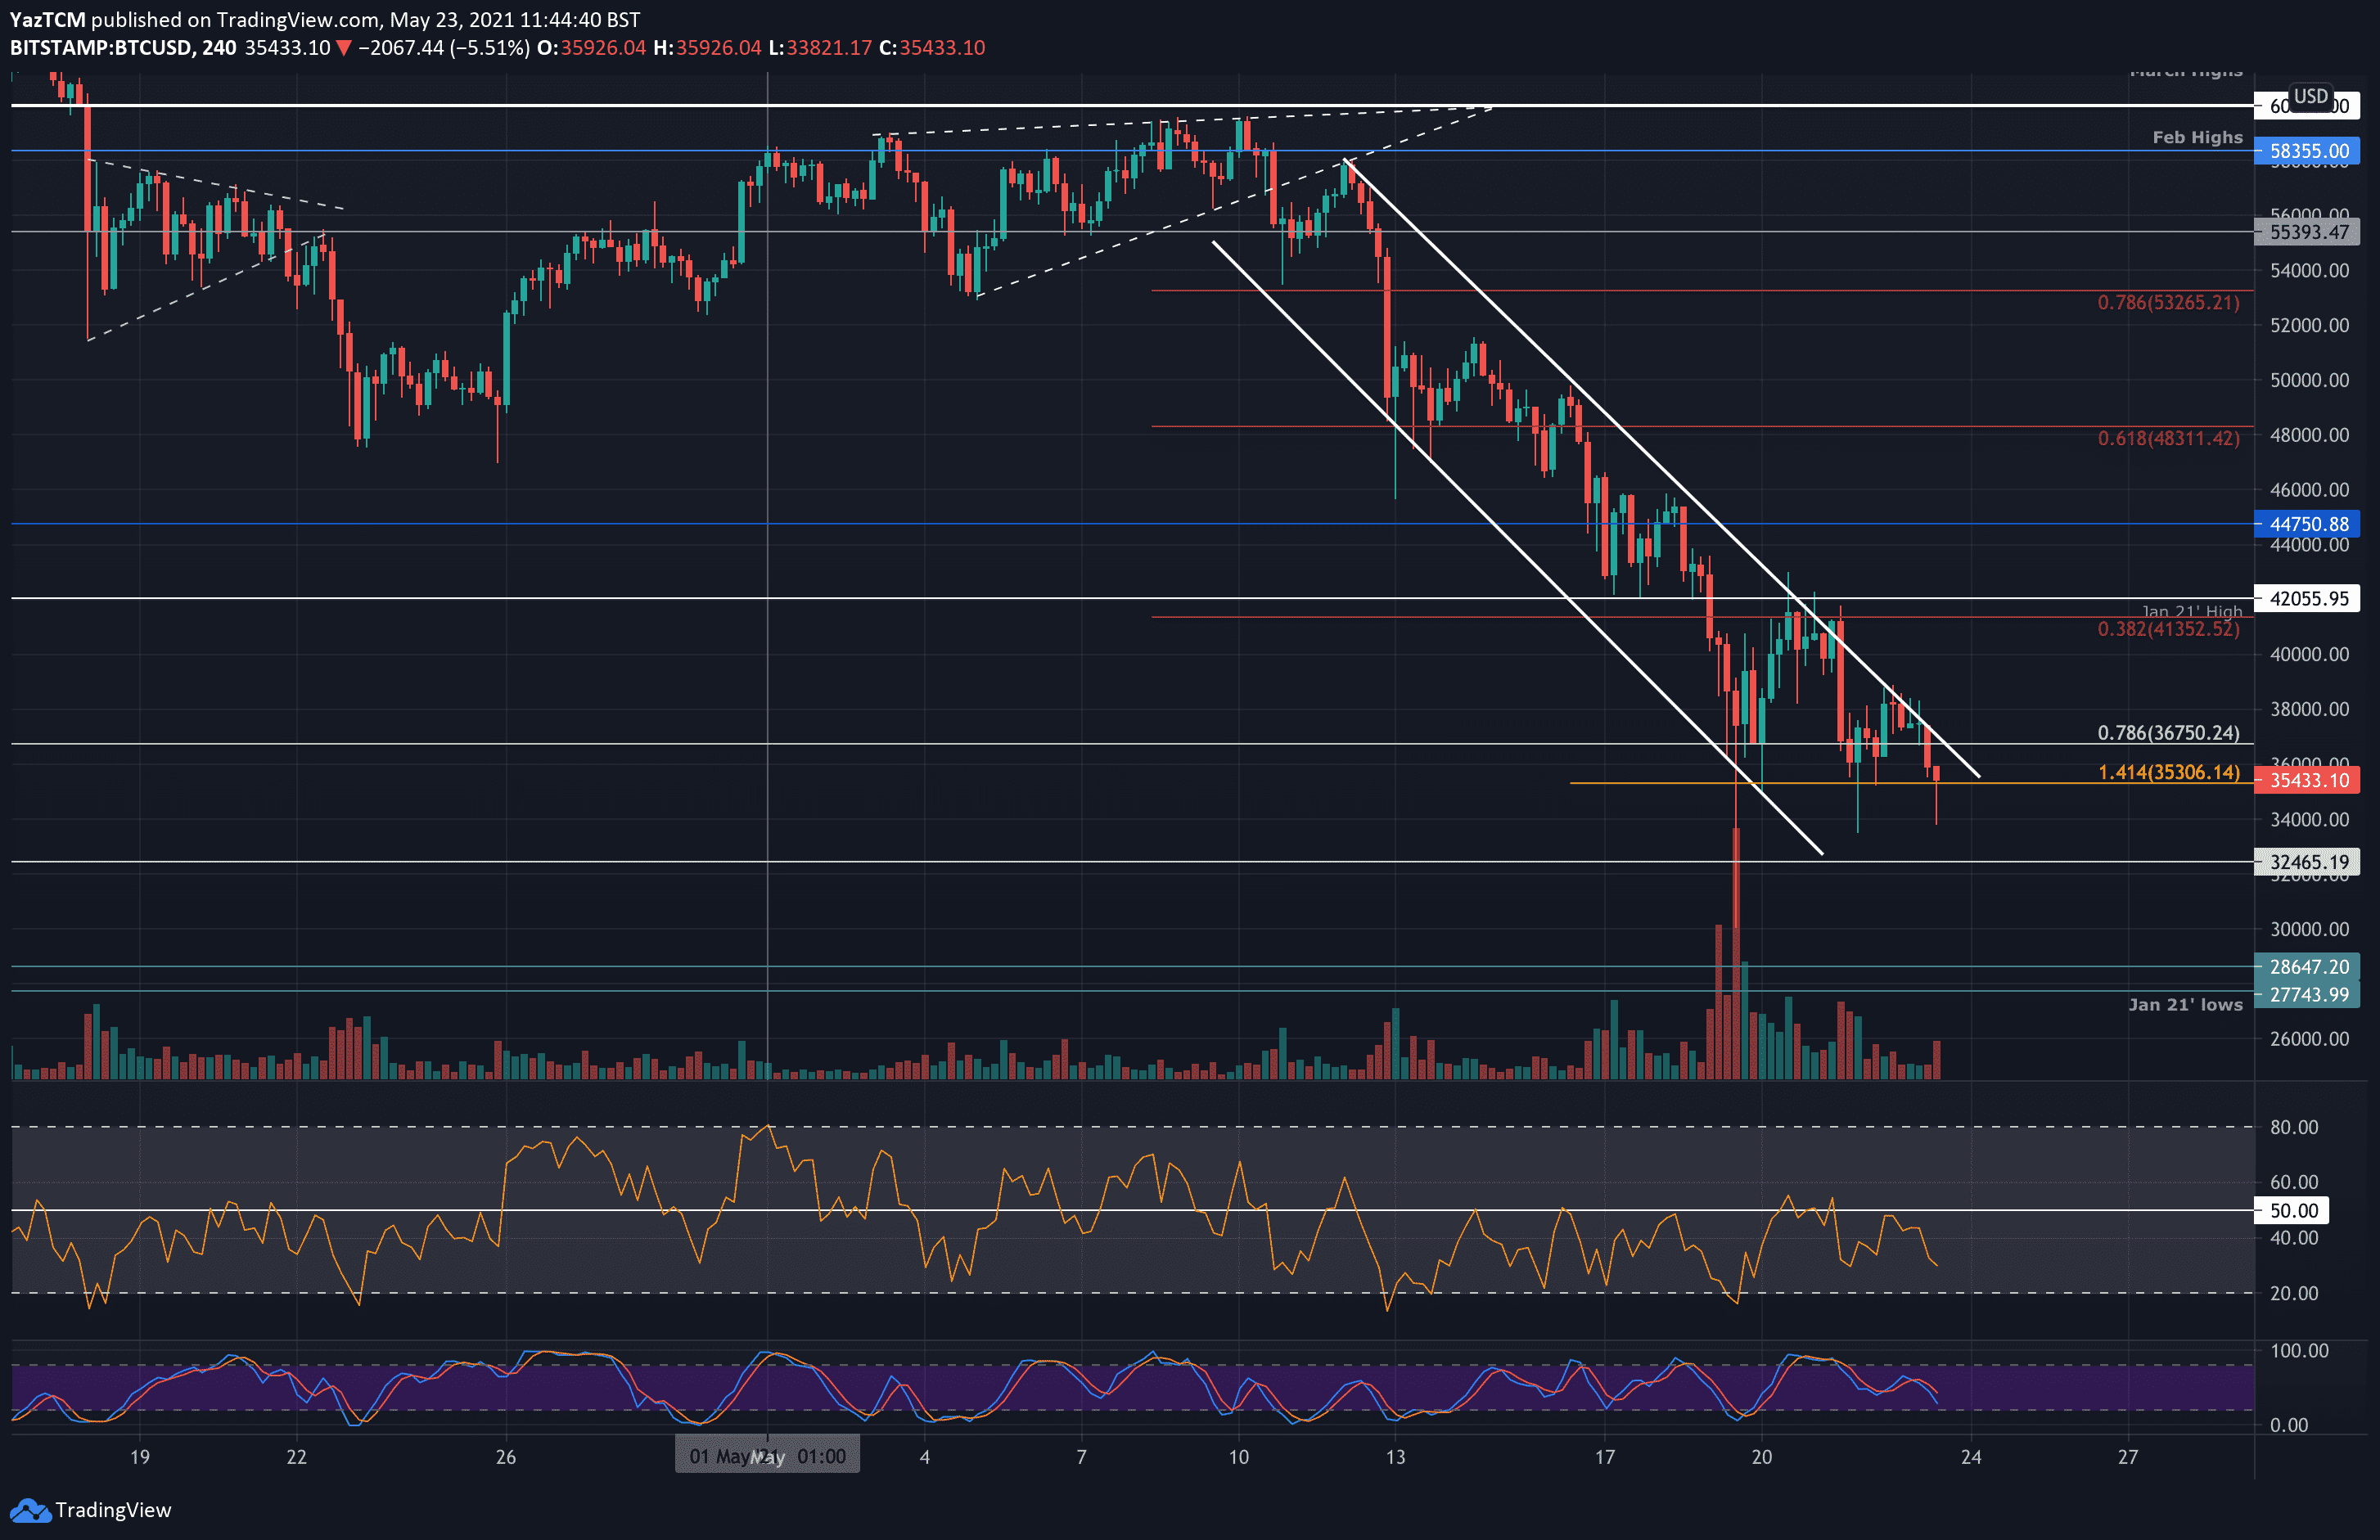
Earlier today (Sunday), the 7% price drop caused BTC to break beneath the support at $36,750 as it spiked as low as $33,820 (as of now). It has since bounced slightly as the bulls attempt to defend short-term support at $35,300 (downside 1.414 Fib Extension) but, with the current bearish momentum within the market, it is likely for this support to break.
As can be seen on the following short-term chart, BTC is trading inside a steep descending price channel. It attempted to break the upper boundary of this price channel over the weekend. Still, the buyers could not overcome resistance at around $41,350 (bearish .382 Fib), together with January’s previous all-time high of $42K, causing the market to continue its severe downtrend.
BTC Price Support and Resistance Levels to Watch
Key Support Levels: $33,520, $32,465, $30,000, $28,650, $27,745.
Key Resistance Levels: $36,750, $38,000, $40,000, $41,350, $42,055.
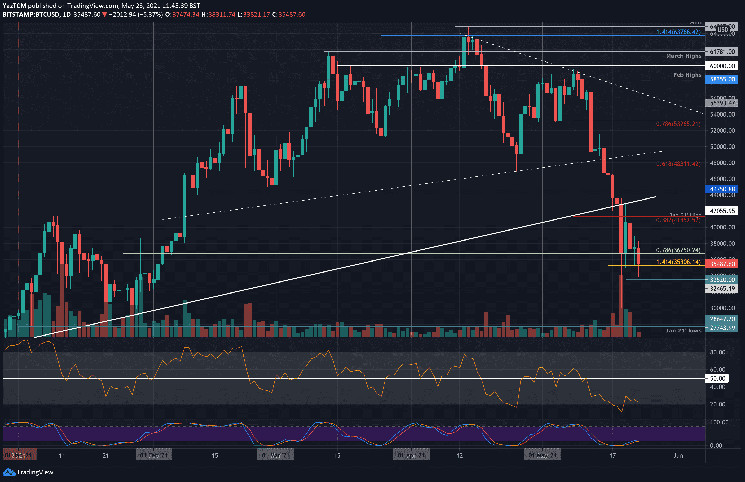
Looking ahead, the first level of strong support beneath $35,300 lies at $33,520 (Friday lows). This is followed by support at $32,465, $30,000, $28,650, and $27,745 (Jan 2021 lows).
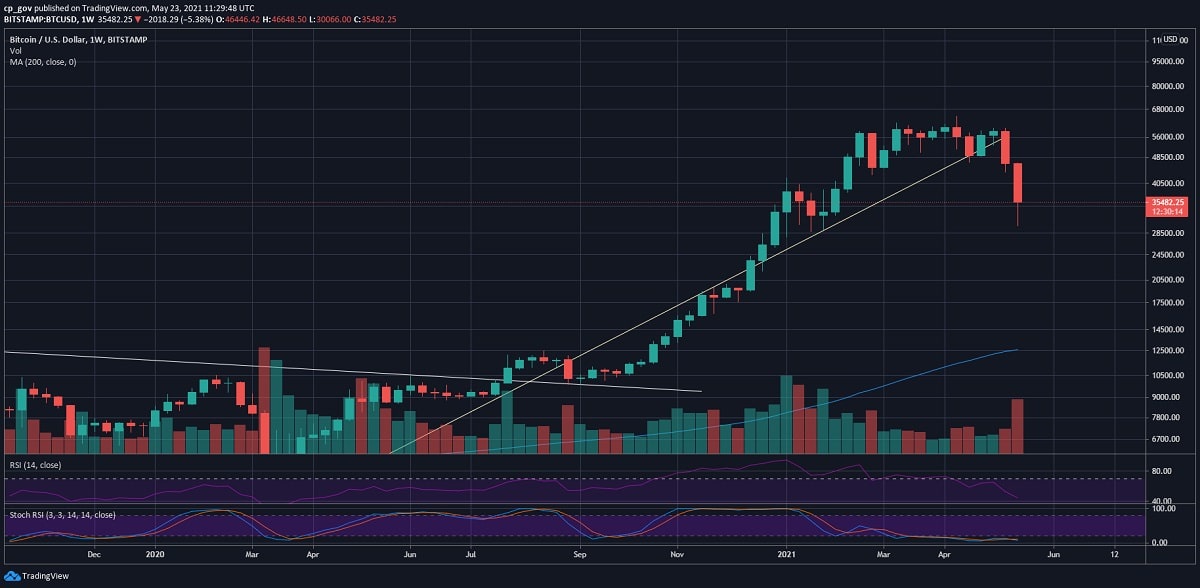
On the other side, the first major resistance lies at $36,750. This is followed by $38,000, $40,000 (which is the critical 200-day moving average line), $41,350 (bearish .382 Fib), and $42,055 (Jan 2021 highs).
The daily RSI is still extremely in the bears’ favor. It had dipped into extremely oversold conditions as the bearish momentum, which is its lowest value since March 2020 (COVID crash).
However, it has since bounced slightly higher as the bearish momentum eased up slightly. Nevertheless, the sellers are in complete control here in the short term. We will need to wait for a higher low on the RSI to act as the first signal that the bears are ready to stop their downward pressure.
Bitstamp BTC/USD Daily Chart
Bitstamp BTC/USD 4-Hour Chart