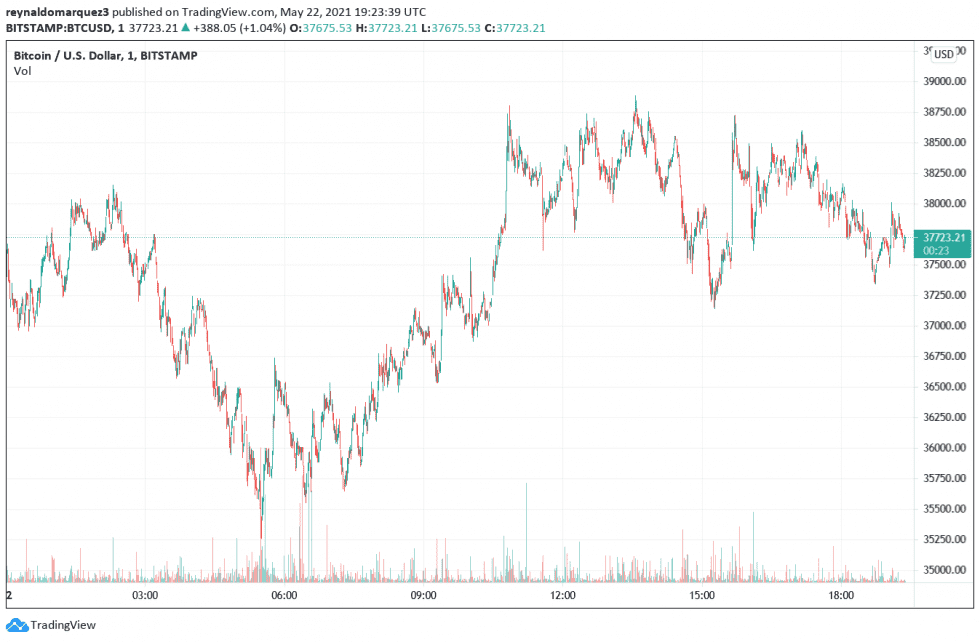
Bitcoin is moving sideways on the higher range of $30,000 with bullish indicators in lower timeframes. The bulls expect a break-out on the previous support, now turned resistance, around $40,000. In the past day, the first cryptocurrency by market cap recorded a low at $33,000 and currently trades at $38,3000.
But while the outlook is bearish on the Bitcoin market, altcoins have seen corrections of up to 40%. Ethereum (ETH), Polkadot (DOT), and Binance Coin (BNB) recorded the worst performance in the top 10 with a 42.4%, 36%, and 48.1% correction, respectively.
Similarly, Cardano (ADA), Dogecoin, and XRP saw similar corrections. The latter has seen a 13.5% correction in the daily chart and has the worst performance in this timeframe.
In higher timeframes, the recently added Internet Computer Price (ICP) has the worst performance after a 56% loss in the 7 day-chart. However, at the time of writing, ICP shows good signs of recovery in the 24-hour chart with a 3.4% profit.
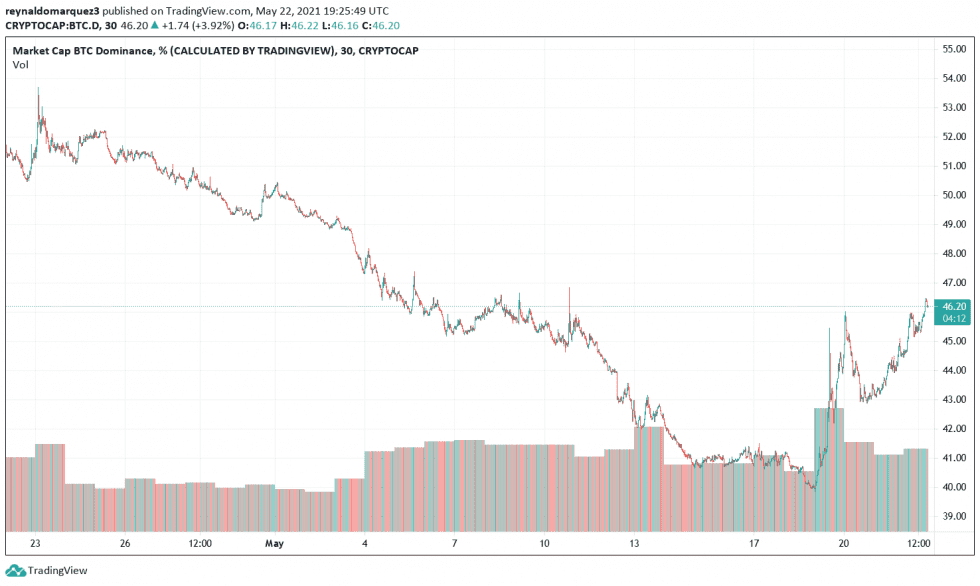
In consequence, Bitcoin dominance has bounced from below 40% to 46.49%, at the time of writing. This metric could persist and go higher in the coming weeks if BTC’s price action continues to move sideways and recovery about the $40,000 area consolidates.
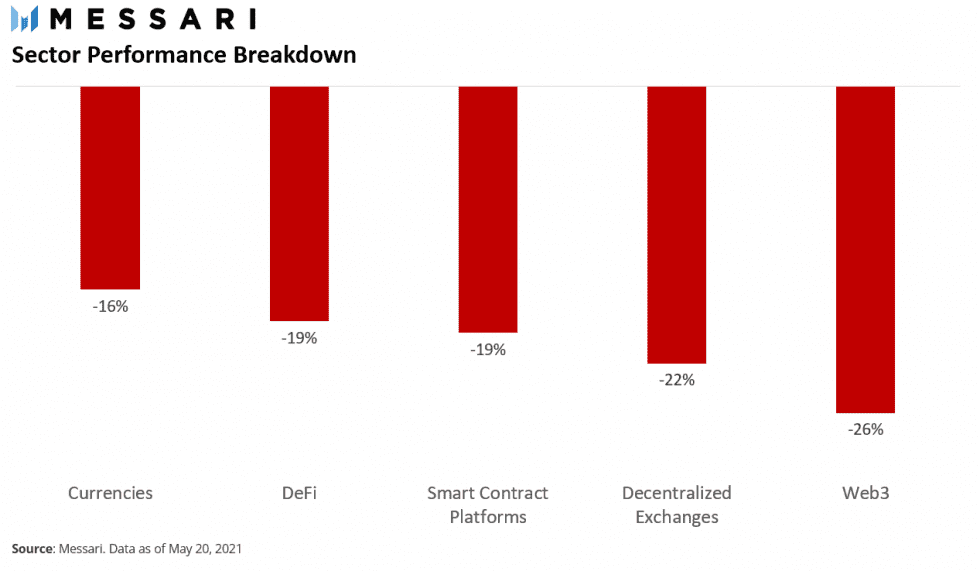
As Bitcoin Dropped, Which Were The Most Affected Sectors?
Research firm Messari published a report, written by analyst Roberto Talamas, after BTC’s price 40% drawdown. The firm determined that the Currencies sector (BTC, ETH, ADA, XRP, and others) recorded fewer losses than the rest with a 16% total, followed closely by the DeFi sector with a 19% decline, Decentralized exchanges with a 22%, and the Web3 sector with a 26% loss respectively.
Talamas offers no single explanation for the selloff in the market. In step, he pointed towards the influence of Tesla’s CEO, Elon Musk, potential Bitcoin regulations in the U.S. and China, and especially a rise in leverage trading on derivatives platforms.
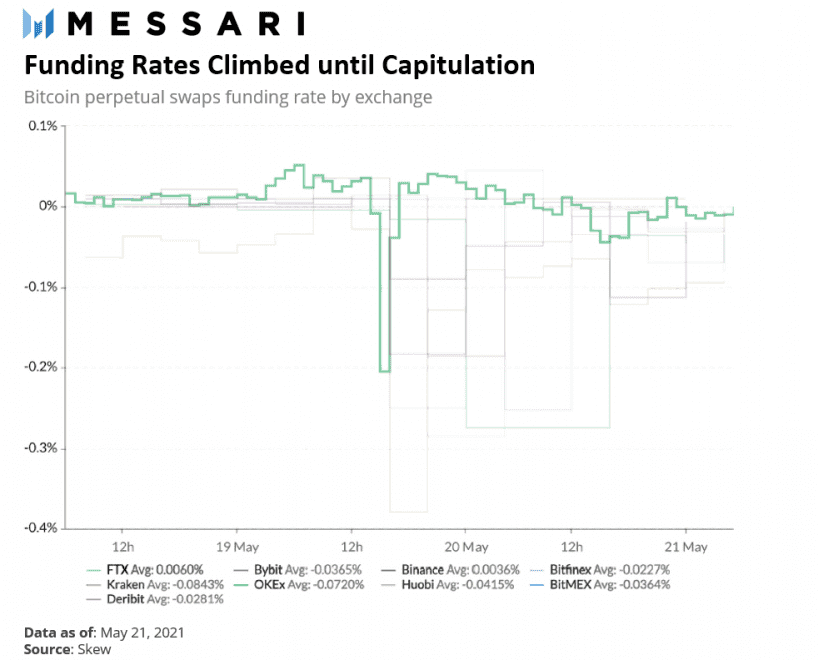
Binance and the other major exchange platforms, except for Bitfinex have positive funding rates, long positions paying short positions, for the past months. However, this metric went sideways during the selloff and was an important catalyst that triggered the flash crash below $30,000. Talamas added:
(…) as prices moved down, traders increasingly bought until they triggered the next liquidation cascade, causing prices to dive further. An example is FTX (where there is more intra-day granular data) — rates were still climbing on the week until it capitulated on May 20.
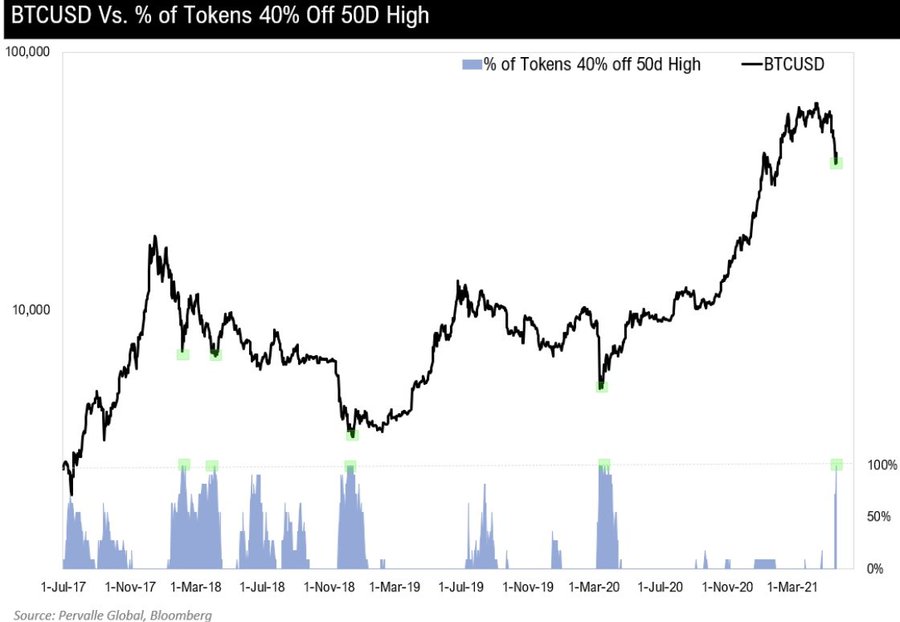
Bitcoin’s dominance rises due to the proportional increase in the correlation between assets. Also, as BTC’s price drops, investors could exit their altcoin positions until there is more certainty in the market. The correlation could be a good indicator to locate BTC’s price bottoms, as CIO of Pervalle Global Teddy Vallee shared and showed in the chart below:
BTCUSD vs. % of tokens 40% off their 50d high. Primarily used to find washouts. Pretty good historically.