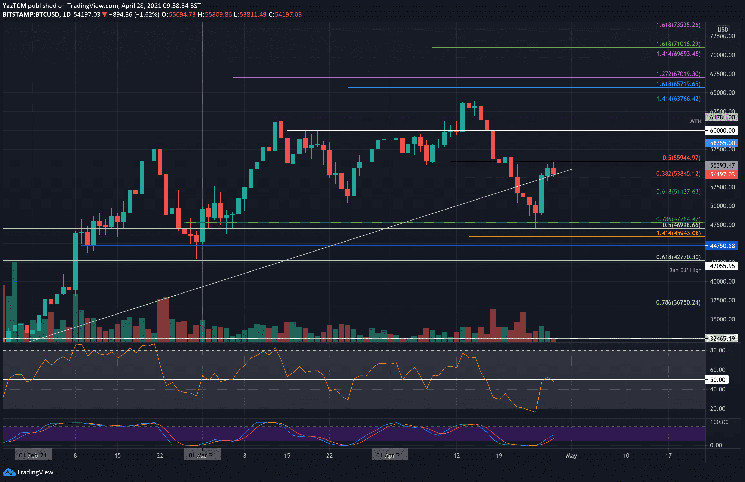
Bitcoin is slightly down today after struggling to hold above the critical level of $55K. This comes following a few bullish days as the primary cryptocurrency rebounded from a two-week downtrend, hitting as low as $47,000 on Bitstamp (.5 Fib) the day before. BTC found support on a 3.5-month old ascending trend-line, which started forming in January.
So far, bitcoin added over $8k to its price, recording today’s low above $55,800 before getting rejected. Looking at the 1-hour chart, it encountered a short-term descending trend-line, and despite the recent bullishness, it still forms a lower-highs trajectory which is textbook bearish (in the mid-term).
The main question is whether bitcoin can regain position upon the 50-day moving average line together with the $57k horizontal support, which will also ‘break’ the lower-highs pattern.
Earlier today, BTC spiked above $55,800 on Bitstamp but quickly reversed back down below the next major resistance level at the mentioned $55K area.
BTC Price Support and Resistance Levels to Watch
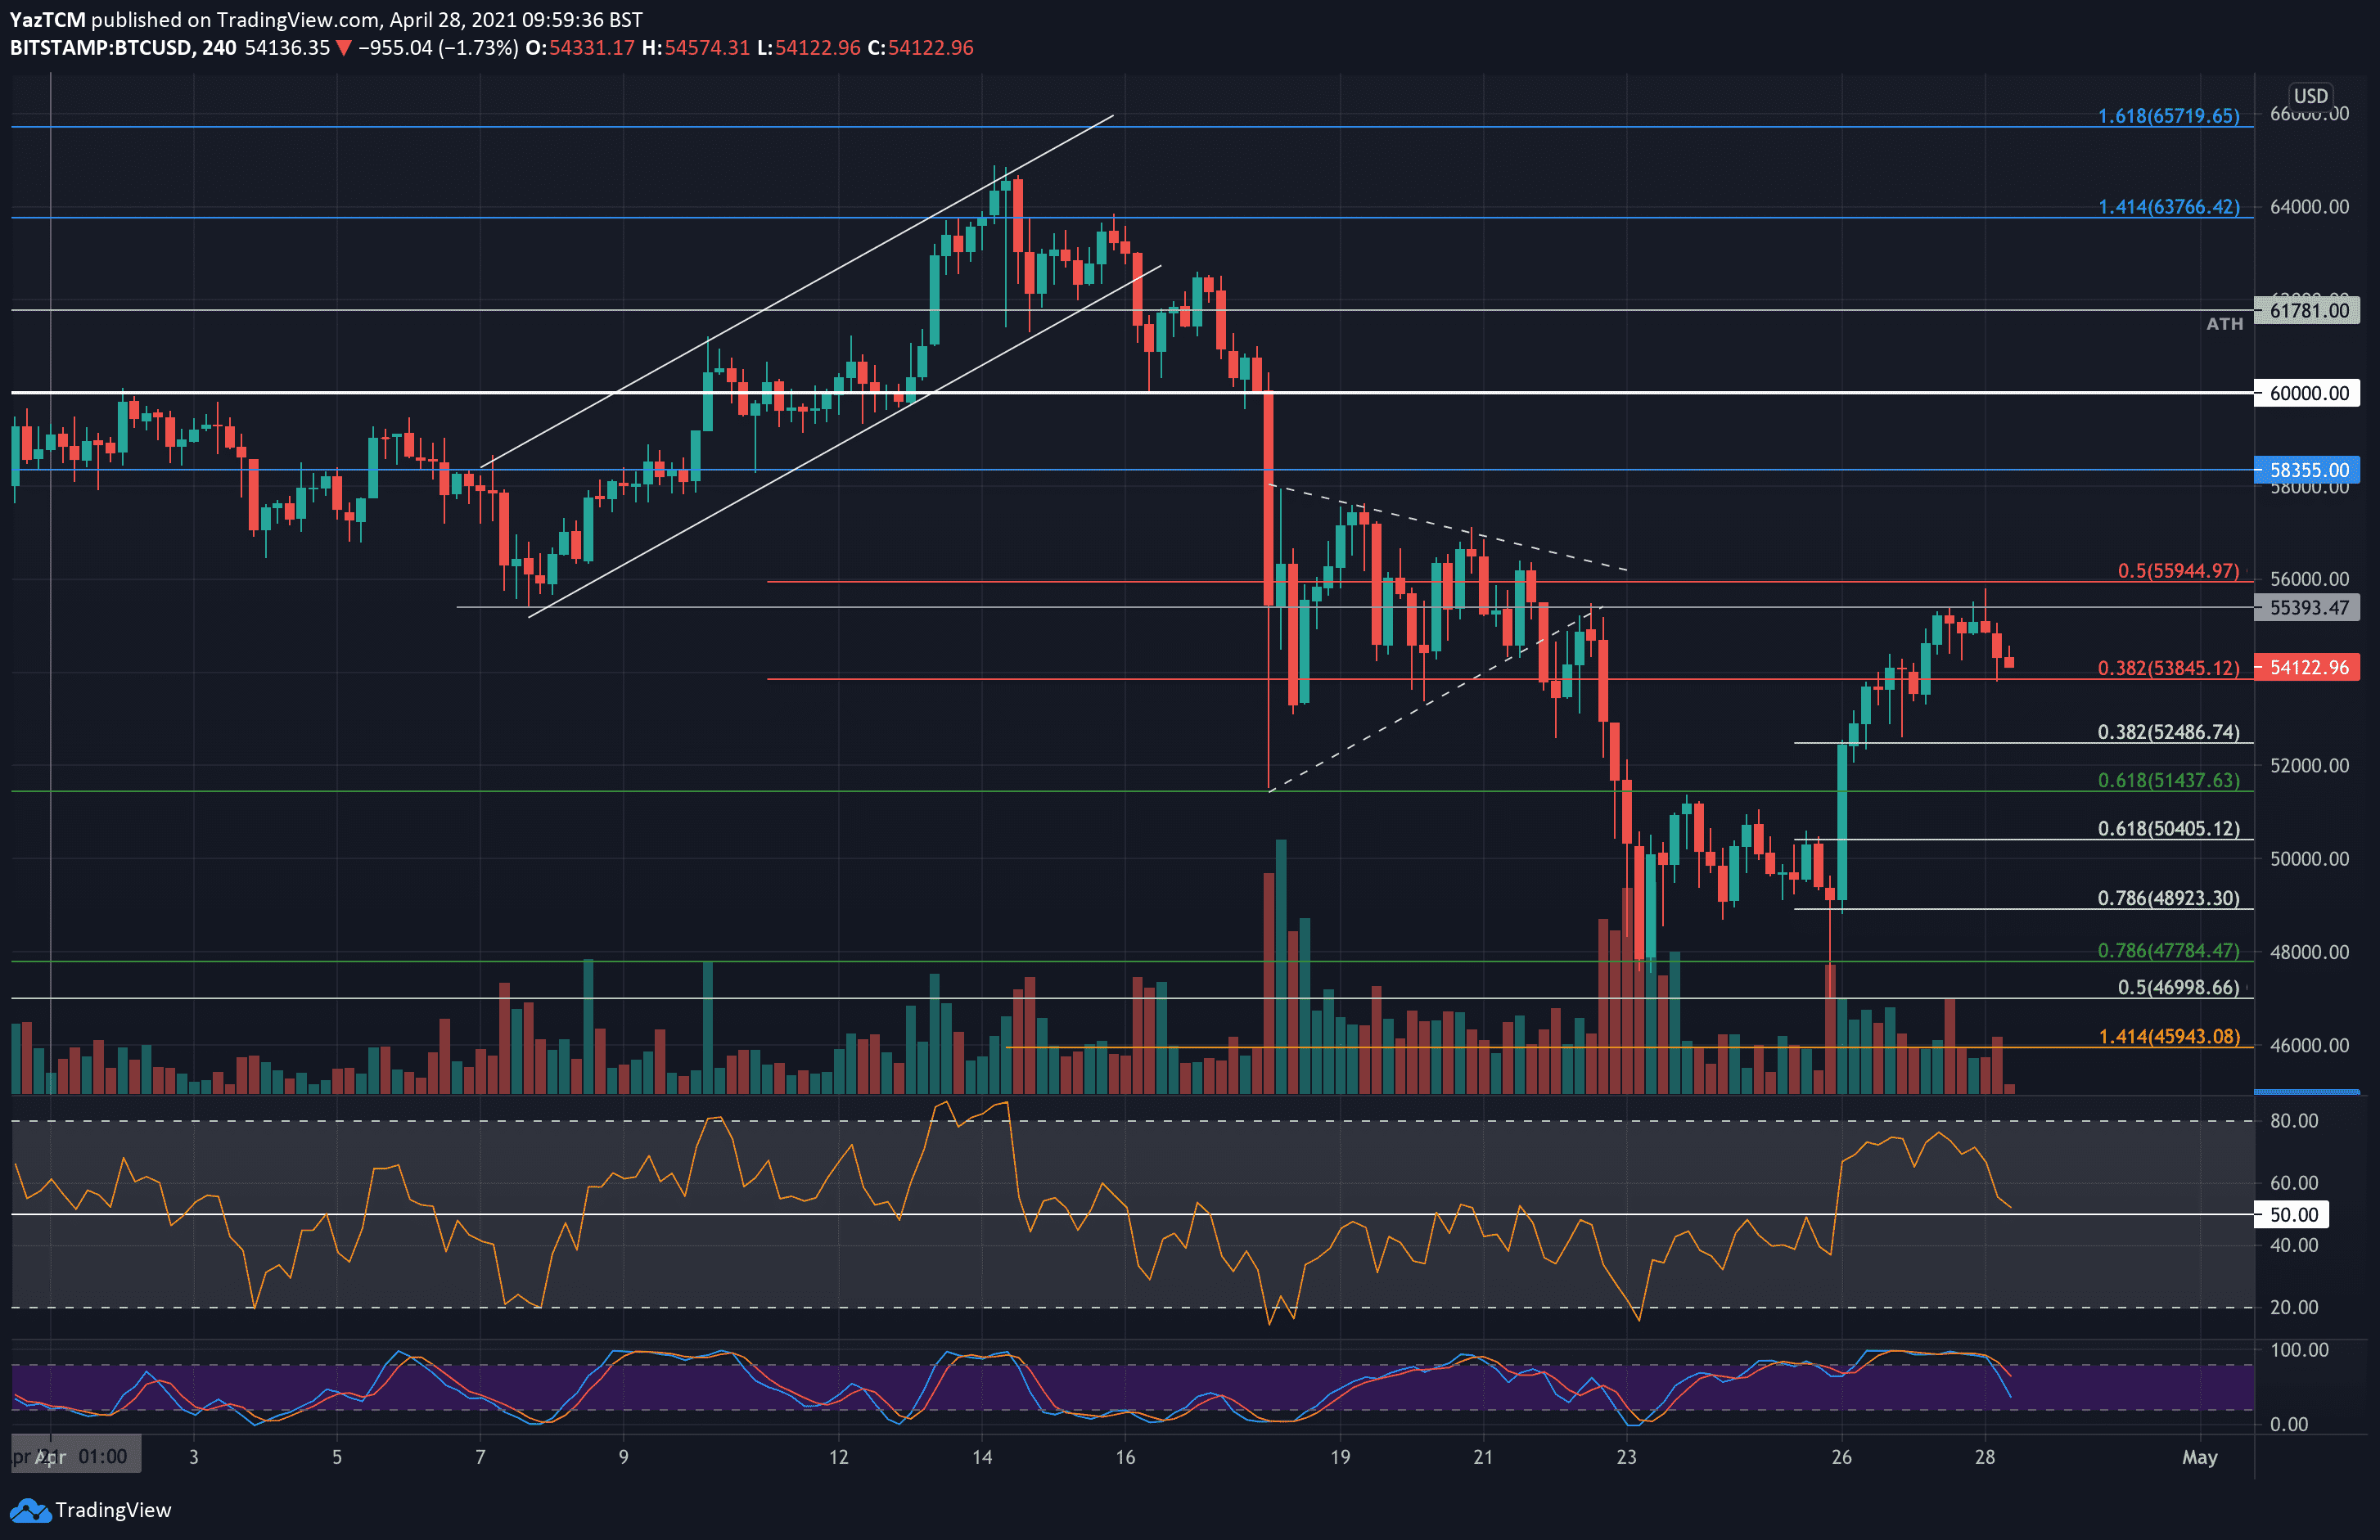
Key Support Levels: $53,845, $52,500, $51,440, $50,500 – $50,000, $48,920.
Key Resistance Levels: $55k – $55,390, $56,000, $57k, $58,355, $60,000.
Looking ahead, the first support lies at $53,845 (bearish .382 Fib). This is followed by $52,500 (.382 Fib and 4-hour’s MA-50 line), $51,440 (long term .618 Fib), $50,400 (.618 Fib), $50,000, and $48,920 (.786 Fib).
On the other side, the first strong resistance lies at $55k – $55,390. This is followed by $56,000 (bearish .5 Fib), major resistance of $57k (daily MA-20 and MA-50), $58,355 (previous ATH from mid-February), and $60,000.
The daily RSI is trading along the midline, indicating indecision within the market. It rebounded from the most oversold conditions since March 2020 at the beginning of the week to return to the 50 level – signaling the previous bearish momentum had dissipated a bit.
Bitstamp BTC/USD Daily Chart
Bitstamp BTC/USD 4-Hour Chart