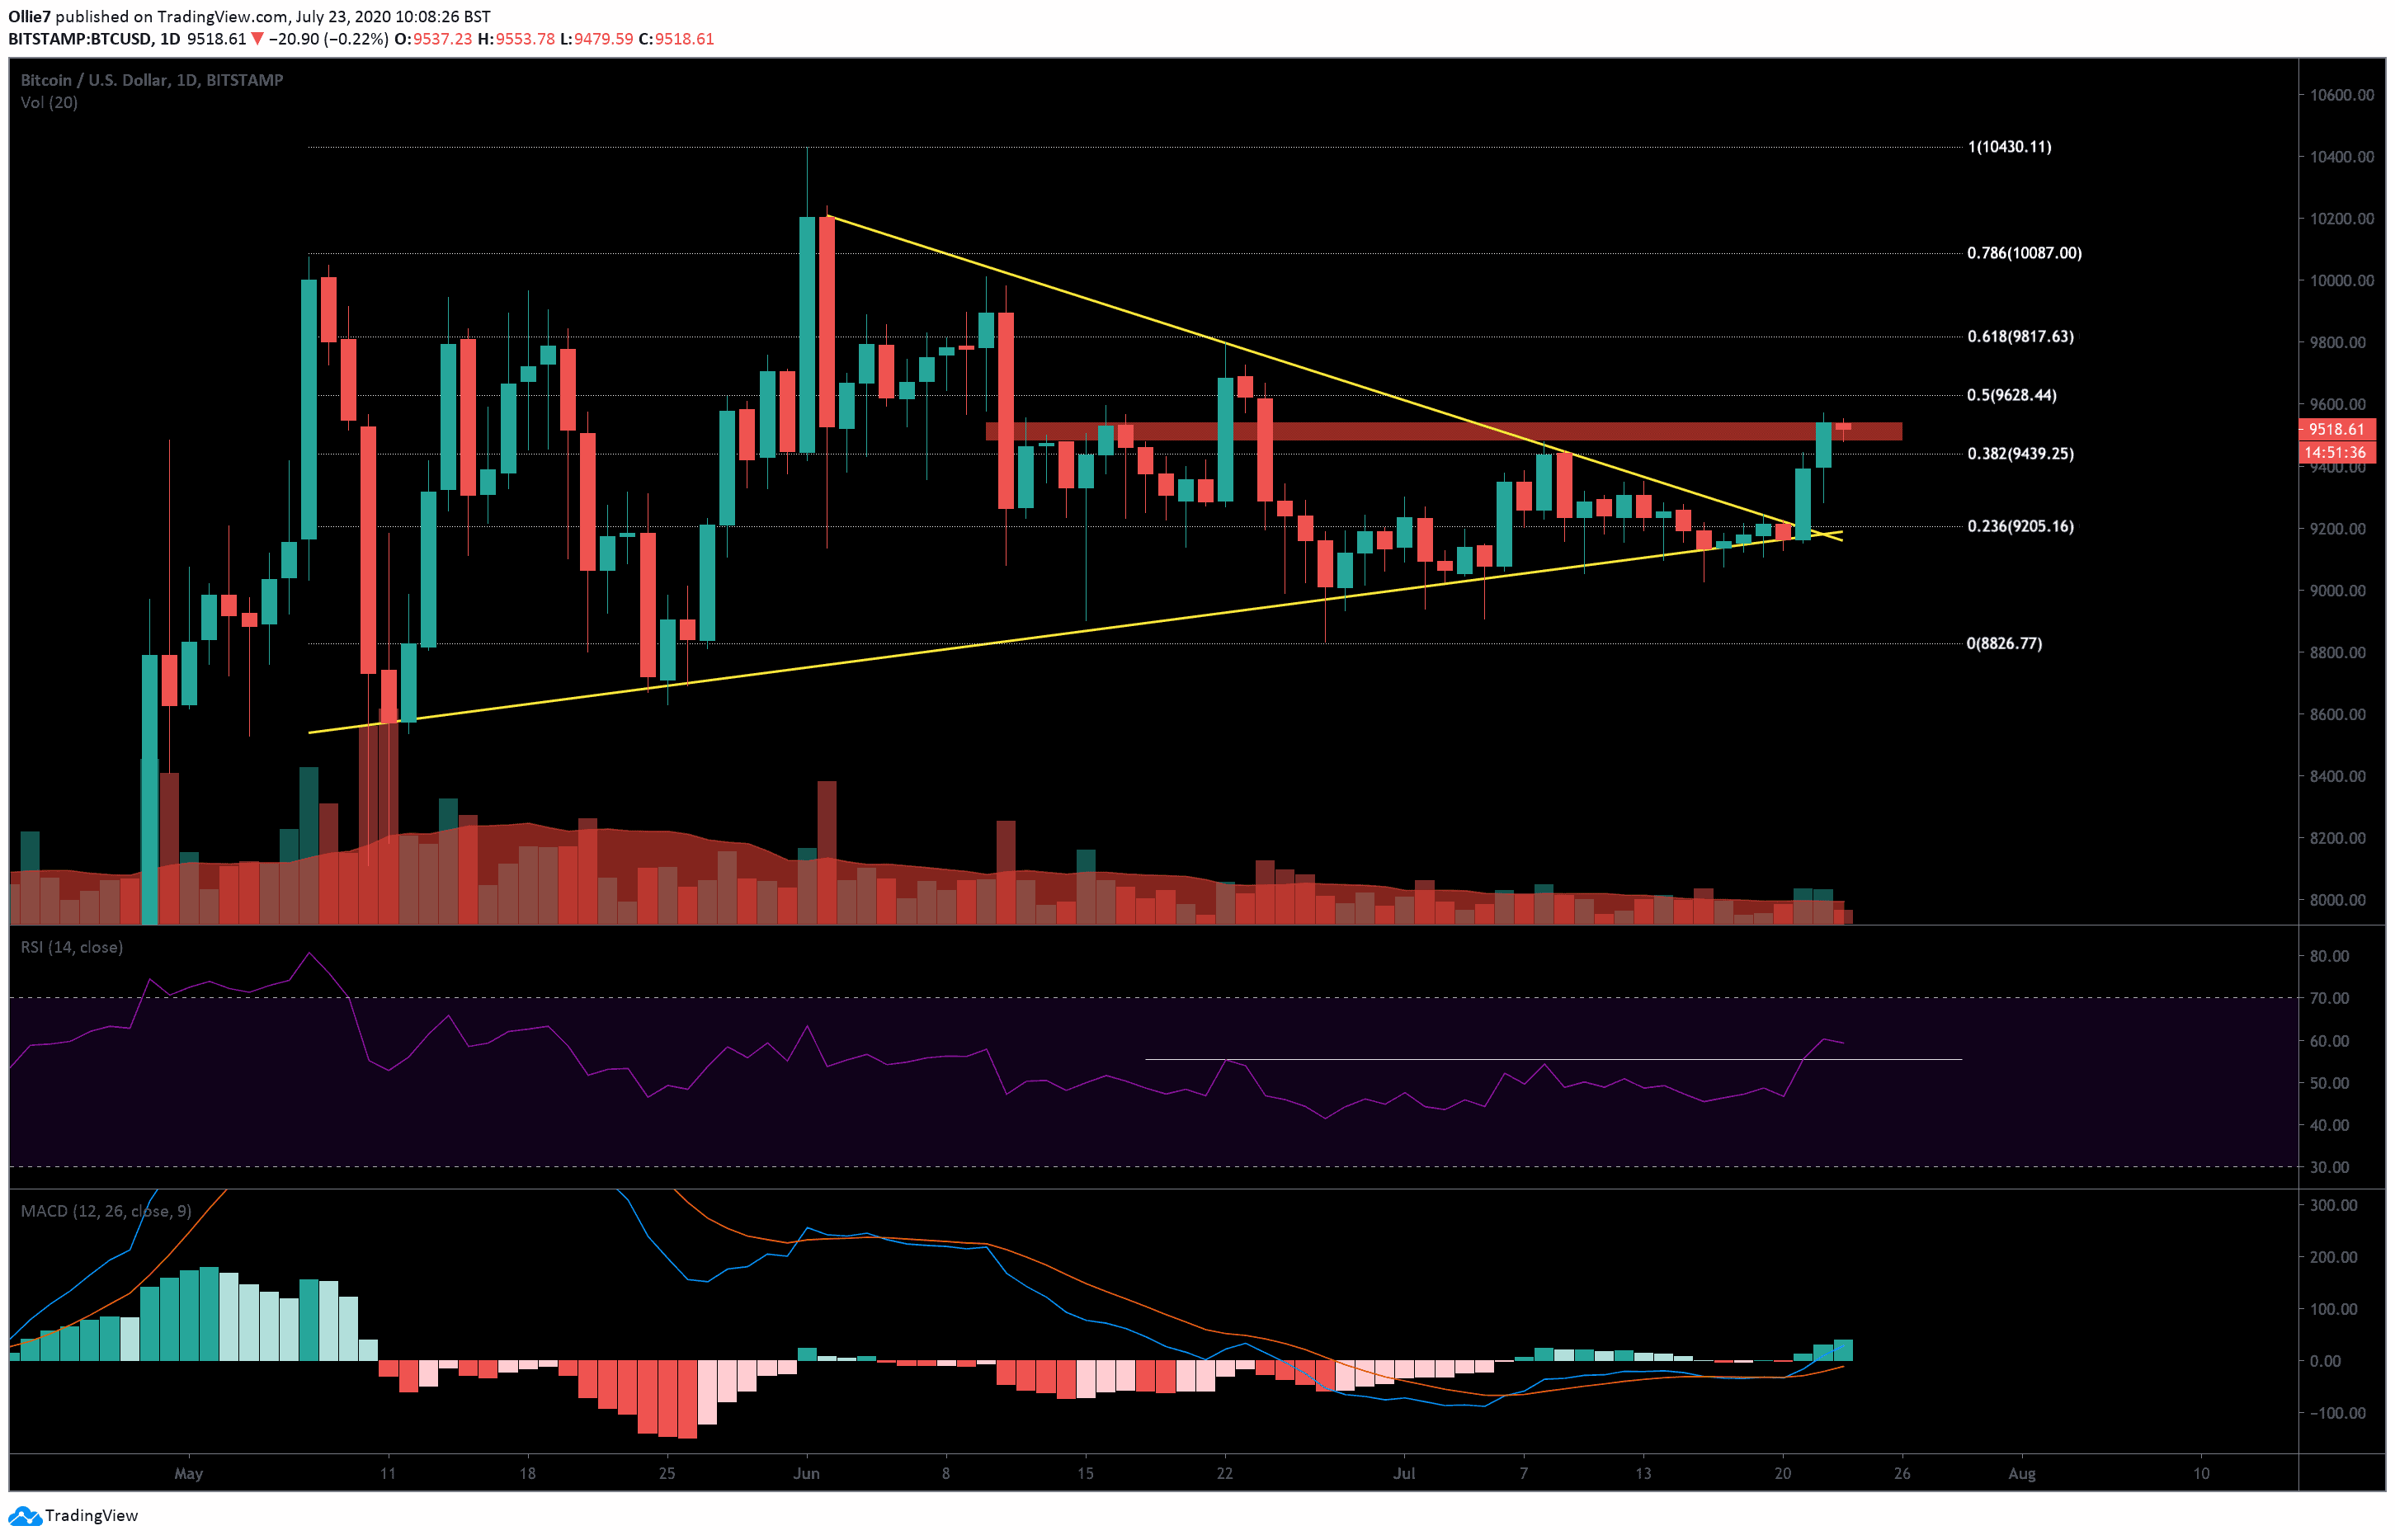
Bitcoin price has finally printed a higher high for the first time in over 50 days, after breaking bullish from the apex of a consolidating pennant (yellow lines on the daily chart).
Over the last seven days, $16 billion had flooded back into the global crypto market, helping to drive the leading crypto and a vast majority of other altcoins back into the green. But how long will this new momentum last?
Price Levels to Watch in the Short-term
On the daily BTC/USD chart, we can see that bullish traders finally managed to overcome the strong 0.236 Fibonacci resistance ($9,205) during the European trading session on July 21.
From there, the asset rallied 2.60% to the next Fibonacci level above at $9,439, before correcting. Bulls were able to refuel at the $9,300 and are now taking on the upper range resistance at the $9,500 mark (red block on the daily chart).
Apart from the Bart Simpson pattern that we spoke about in an earlier analysis on July 9, this key range resistance has prevented bitcoin from making a higher high for 42 days. If BTC can close convincingly above this level, then the next target for bullish traders will be the $9,700 level.
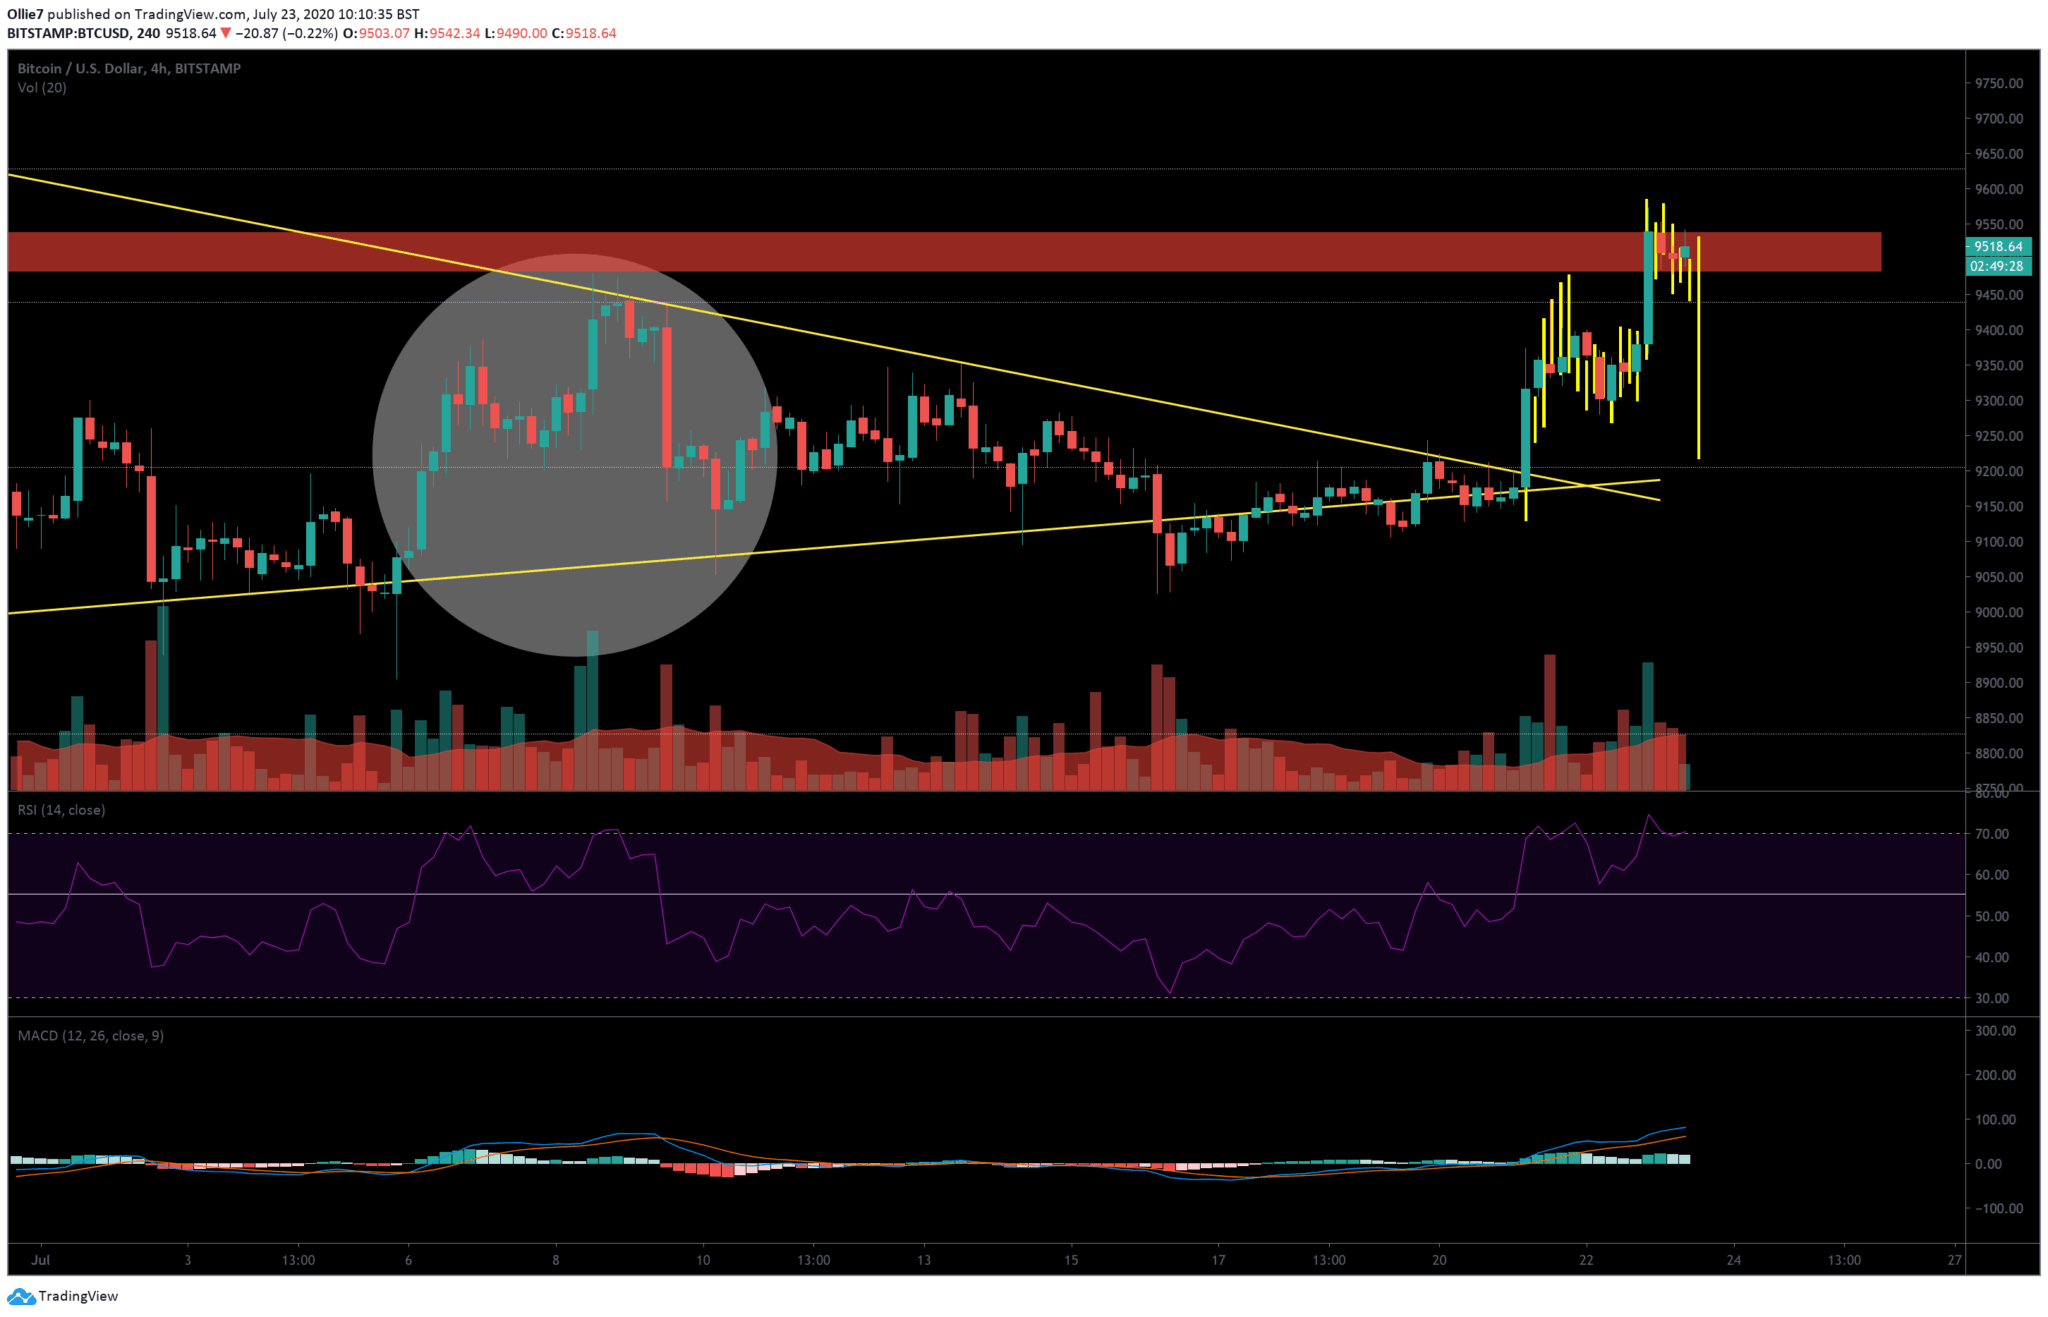
Looking at the 4H chart, however, we can see that the current price action resembles a bearish fractal from between July 6 – 9 (white circle). On July 6, BTC spiked upward. Then, the price snaked for two days, followed by a second uptrend. And then finally, on July 9, the price crashed by 2.70%.
If we project that fractal on the current price action, we can see that it lines up pretty well.
The Technicals
Over the smaller 1-hour time frame, we can see long wicks above the last several candles, which shows bulls are facing a lot of selling pressure right now.
On the RSI, over the same time frame, we can see the indicator line is falling even though BTC is currently retesting the same high as before. This suggests that momentum is weakening – however, it should be noted that smaller time frames do not give as strong a signal as larger time frames.
On the 4H RSI, prices have corrected back into the index channel after temporarily spiking into the ‘overbought’ region above 70, and buying volume on the MACD indicator also appears to be decreasing. This could be a sign that either the trend is beginning to reverse, or that a brief correction will occur as bulls take a moment to recover.
All eyes should be on that $9,500 level right now.
Total Market Capital: $289 billion
Bitcoin Market Capital: $175 billion
Bitcoin Dominance Index: 60.6%
*Data via Coingecko.
BTC/USD Bitstamp Daily Chart
BTC/USD Bitstamp 4-Hour Chart