- Bitcoin is trading almost 12 percent below from its local top near $10,400, but a historically accurate technical indicator hints a trend reversal.
- The pattern formed on Monday as the short-term moving average of Bitcoin’s hash rate jumped over the long-term moving average, signaling the beginning of a buying setup.
- Its previous two formations over the last 12 months led the price higher by circa 45 percent.
- That roughly puts Bitcoin’s next upside target near $13,000 or beyond.
Bitcoin bulls may prefer to hold onto their long-term upside sentiment as the cryptocurrency paints a historically accurate bullish setup.
On Monday, the BTCUSD daily chart flashed a “Buy” signal based on the readings provided by “Hash Ribbons.” The technical indicator combines the short-term moving average of Bitcoin’s hash rate with the long-term moving average.
If the former jumps above the latter, then it points to a growing buying sentiment among traders, as shown in the chart below.
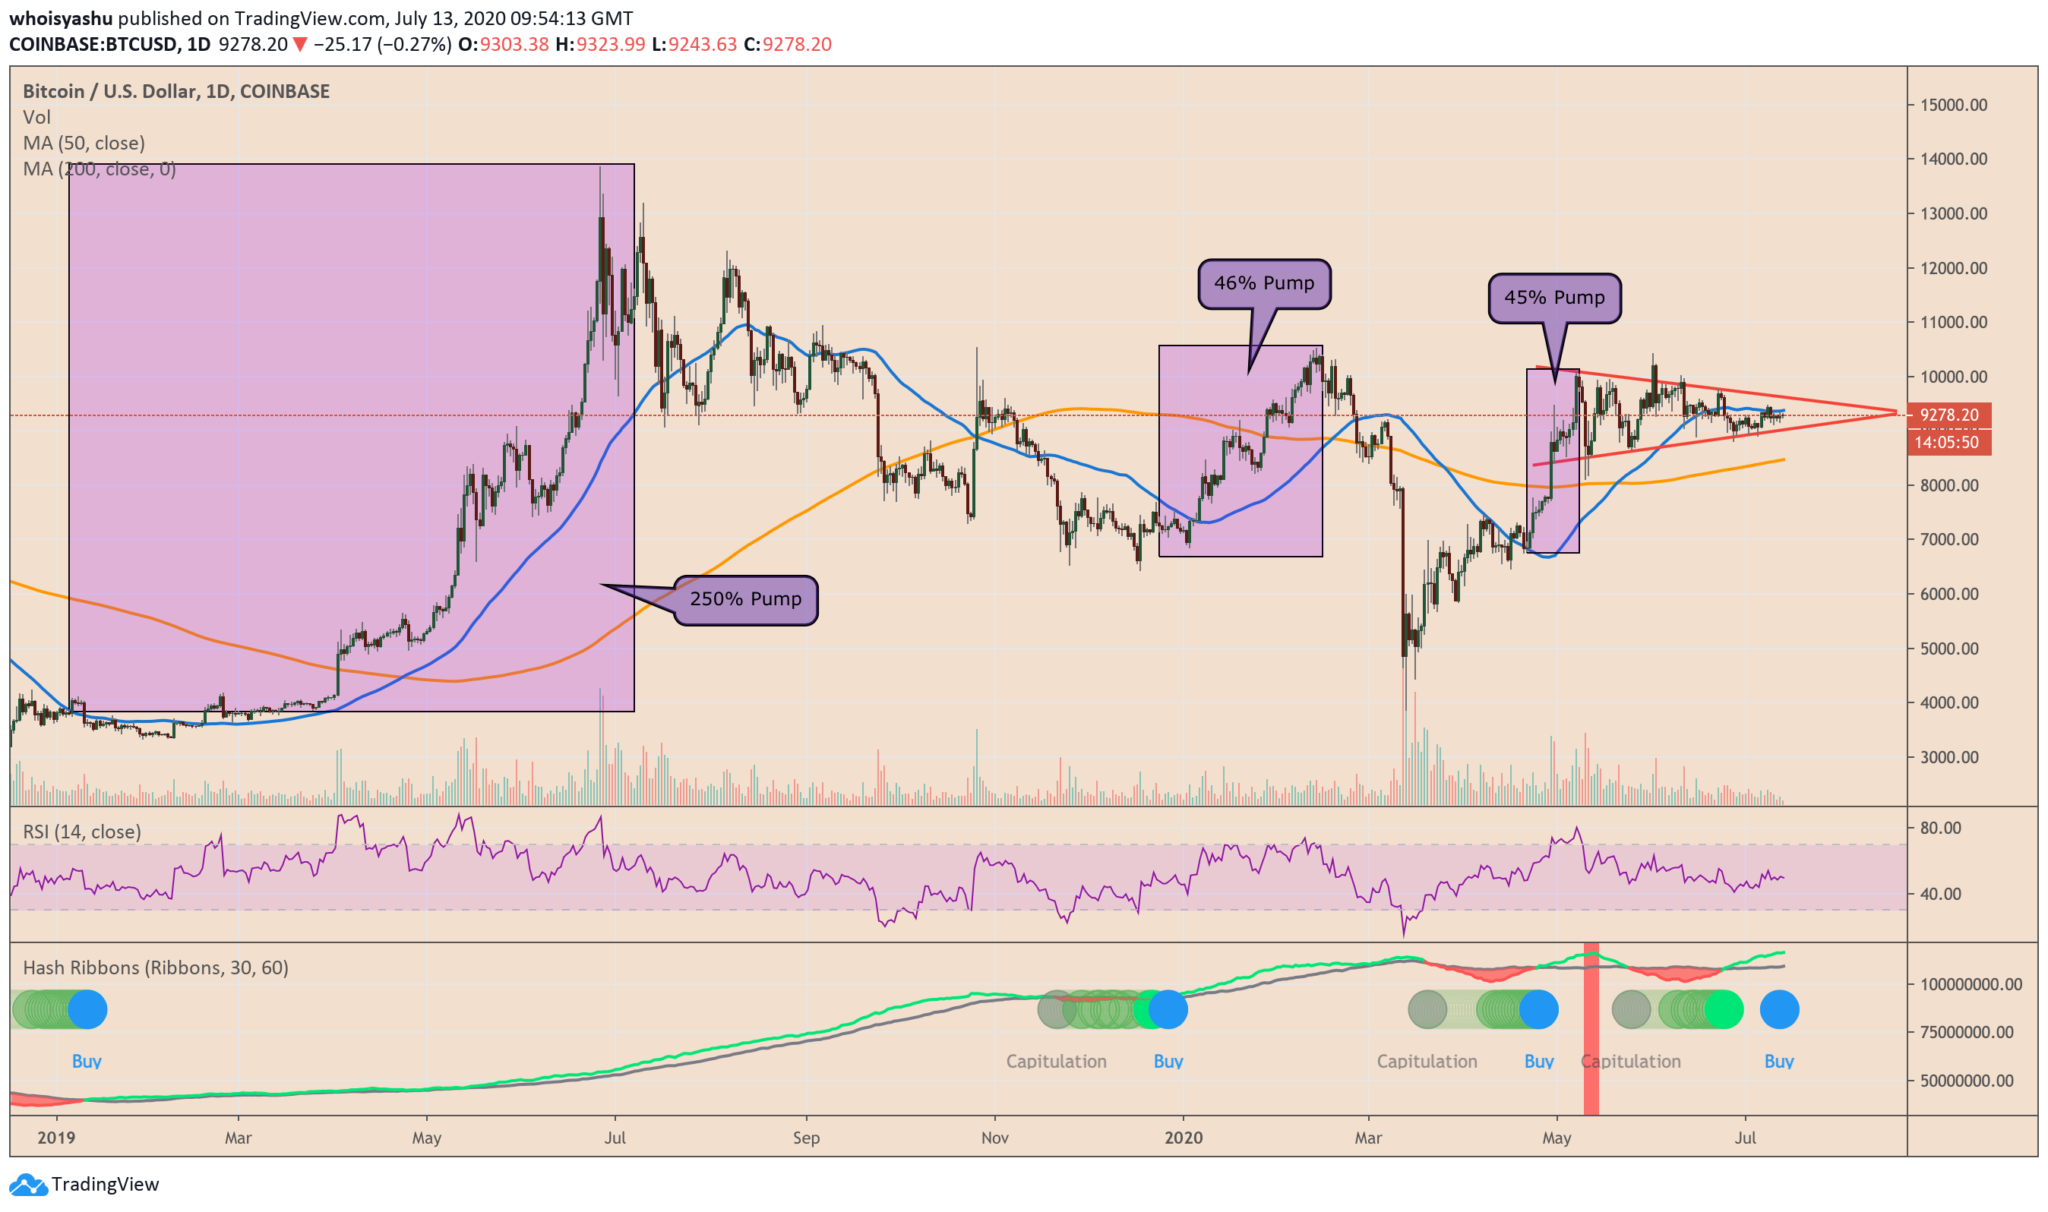
Bitcoin Hash Ribbons flashes a "Buy" signal. Source: TradingView.com
The blue dot signals the beginning of a bull trend, pointing out that miners, the individuals/firms that mine Bitcoin, are accumulating more Bitcoin than selling them in the retail market. Earlier in April 2020, the same indicator has assisted in propelling the BTCUSD rate 45 percent higher.
Similarly, in December 2019, the arrival of Hash Ribbon’s blue dot sent the BTCUSD rate up by 46 percent. Its formation in January 2019, meanwhile, started a parabolic bull move wherein the pair rose by as much as 250 percent.
A Post-Halving Setup
The Hash Ribbons signal also follows Bitcoin’s third halving, a May 11 event that slashed the cryptocurrency’s daily supply limit from 1,800 BTC to 900 BTC. It initially impacted miners whose mining reward got reduced by half overnight.
Therefore, they started selling their existing Bitcoin holdings to cover their operational costs, driving the cryptocurrency’s price down, as a result.
But with Hash Ribbons signaling a “Buy” setup, it shows miners have reduced dumping their newly minted Bitcoin. That effectively limits the flow of new units into the over-the-counter and retail markets, creating a supply deficit against a steady/rising demand.
#Bitcoin Hash Ribbons "Buy" signal just confirmed.
The post-Halving signal is particularly special.
It will probably be a very long time until the next occurs.…and so the great bull run begins.https://t.co/l90SDYs8kC
— Charles Edwards (@caprioleio) July 13, 2020
That is what halving does in totality: the event keeps Bitcoin deflationary by limiting its supply after every four years. Hash Ribbons, on the other hand, reflects the accumulation/capitulation behavior of miners.
Converging Bitcoin Bullish Indicator
Bitcoin now eyes at least a 45 percent jump after flashing the buy signal. That safely puts the cryptocurrency’s medium-term next upside target near $13,000. But as to when the cryptocurrency would test the said level, one has to look beyond Hash Ribbons.
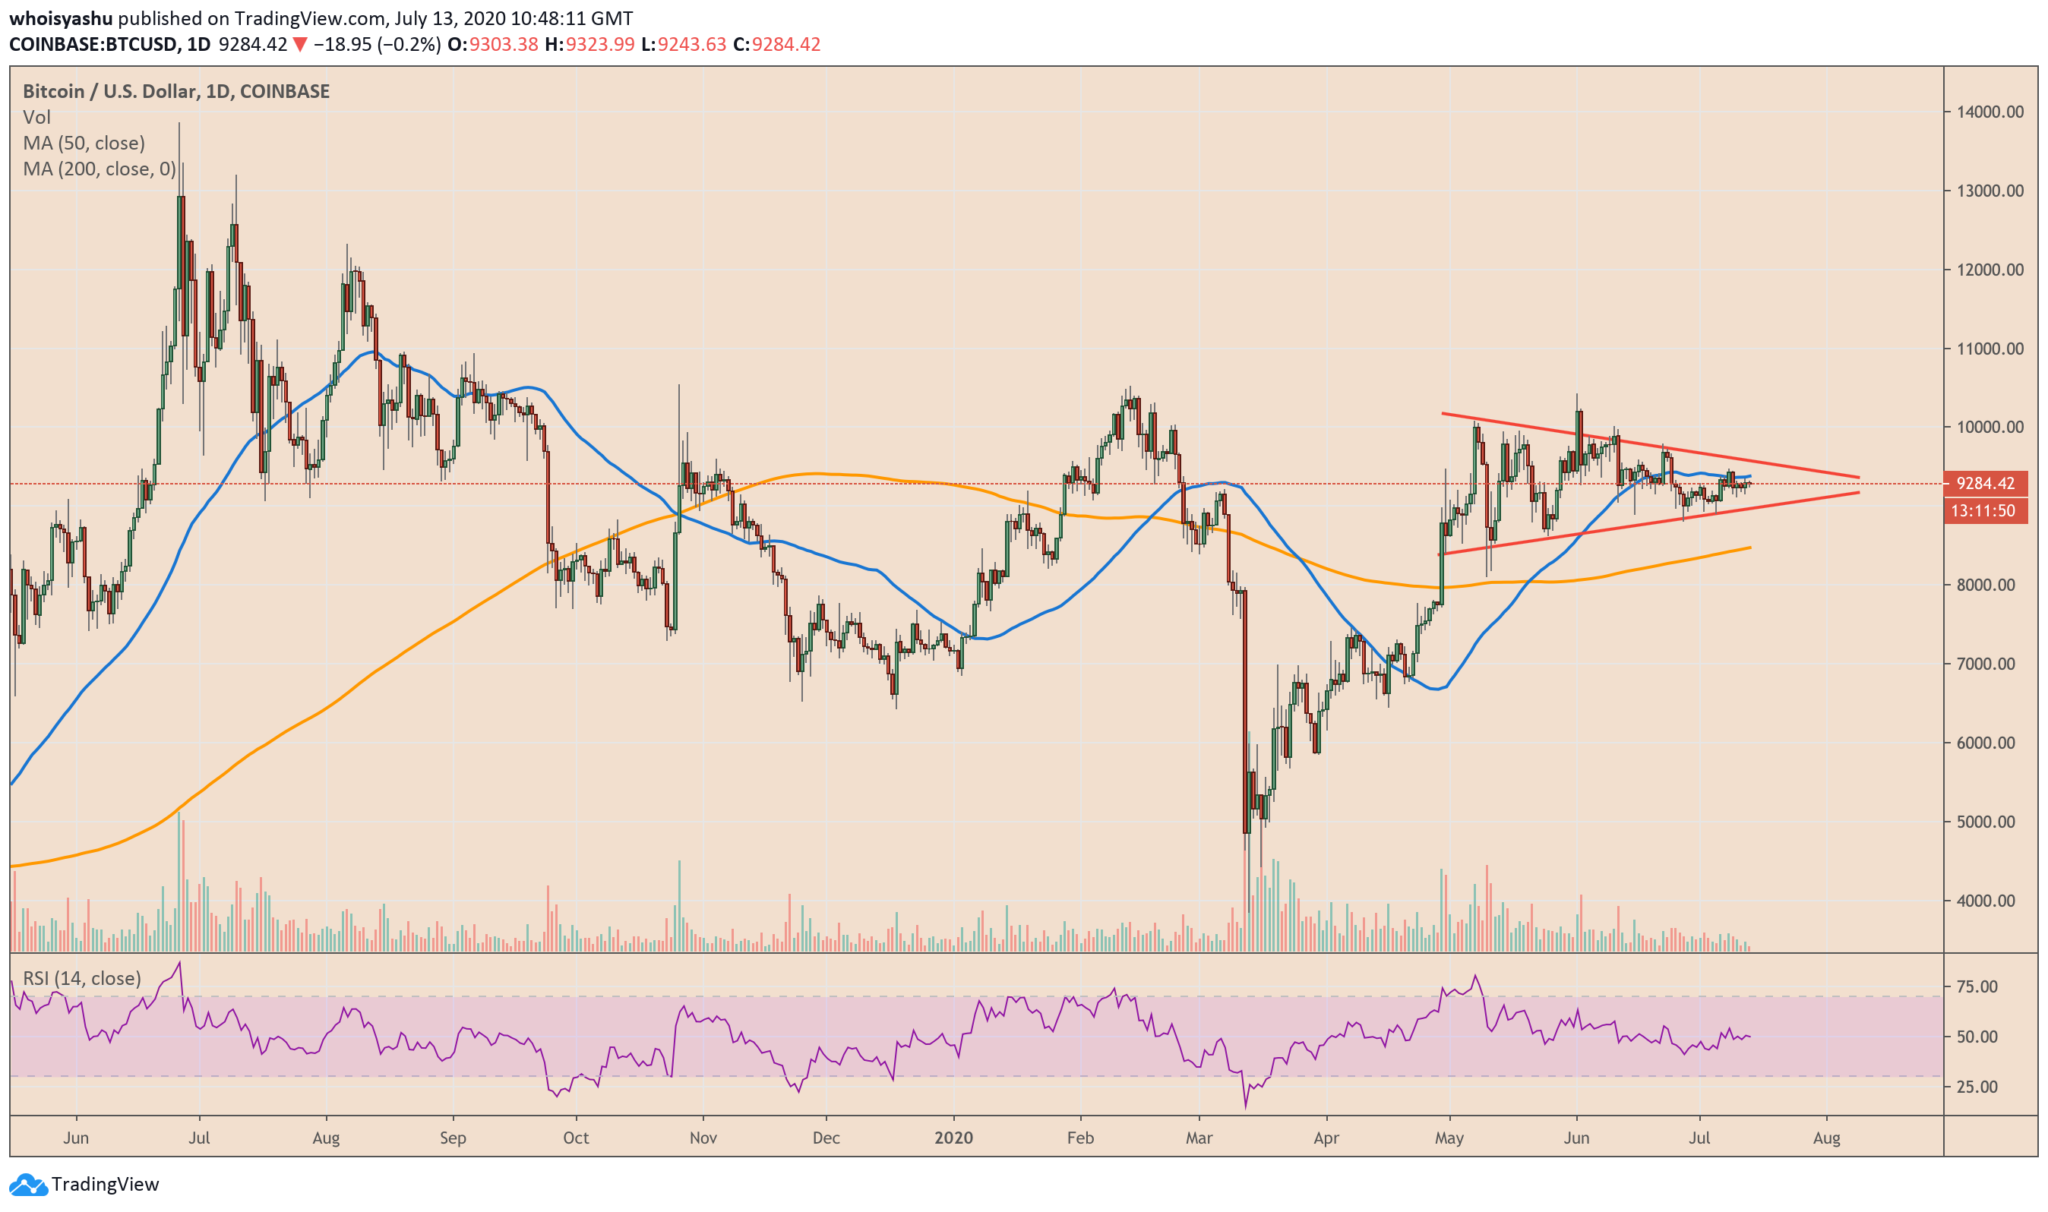
Bitcoin's symmetrical wedge pattern in an uptrend breaks bullish 70 percent of all times. Source: TradingView.com
Bitcoin may undergo an upside breakout later in August 2020, based on its symmetrical wedge pattern‘s formation.
The cryptocurrency has been trading inside the ‘red area,’ as shown in the chart above, since May 7, 2020. Its prevailing trend before forming the wedge was bullish, which technical means that there is a 70 percent chance that Bitcoin breaks the pattern to the upside.
The first signs of breakout may appear in the first week of August, the period wherein the Wedge’s two trendlines expects to converge. As Bitcoin breaks above the pattern, it may attempt to test $13,000, the Hash Ribbon’s price target.
Photo by 2Photo Pots on Unsplash