After consolidating for roughly one week, Bitcoin (BTC) has begun an upward move towards a short-term resistance level.
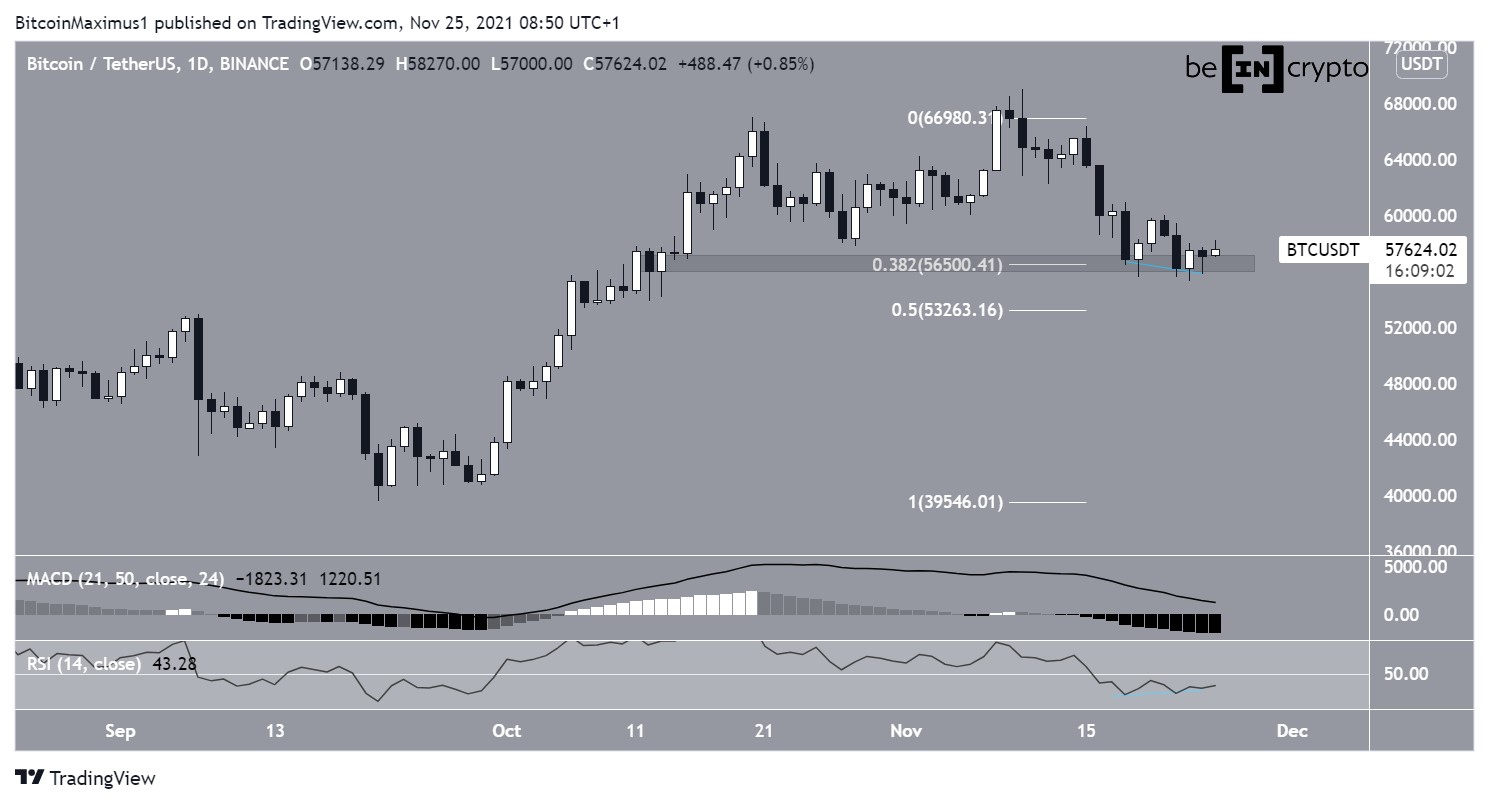
Bitcoin has been falling since Nov 10 after it reached an all-time high of $69,000. On Nov 23, it fell to a local low of $55,317.
However, it has been moving upward since then and has rebounded from the $56,500 horizontal support area. This is also the 0.382 Fib retracement support level, further increasing its significance.
Bitcoin technical indicators
Technical indicators are showing bullish signs since the RSI has generated bullish divergence. This occurs when a price decrease is not accompanied by an equal decrease in selling momentum
However, the MACD is still falling. This is an indicator that is created by short and long-term moving averages (MA). The fact that it’s decreasing means that the short-term MA is decelerating faster than the long-term average.
If a breakdown were to occur, the next support would be found at $53,260. This is the 0.5 Fib retracement support level when measuring the most recent upward movement.
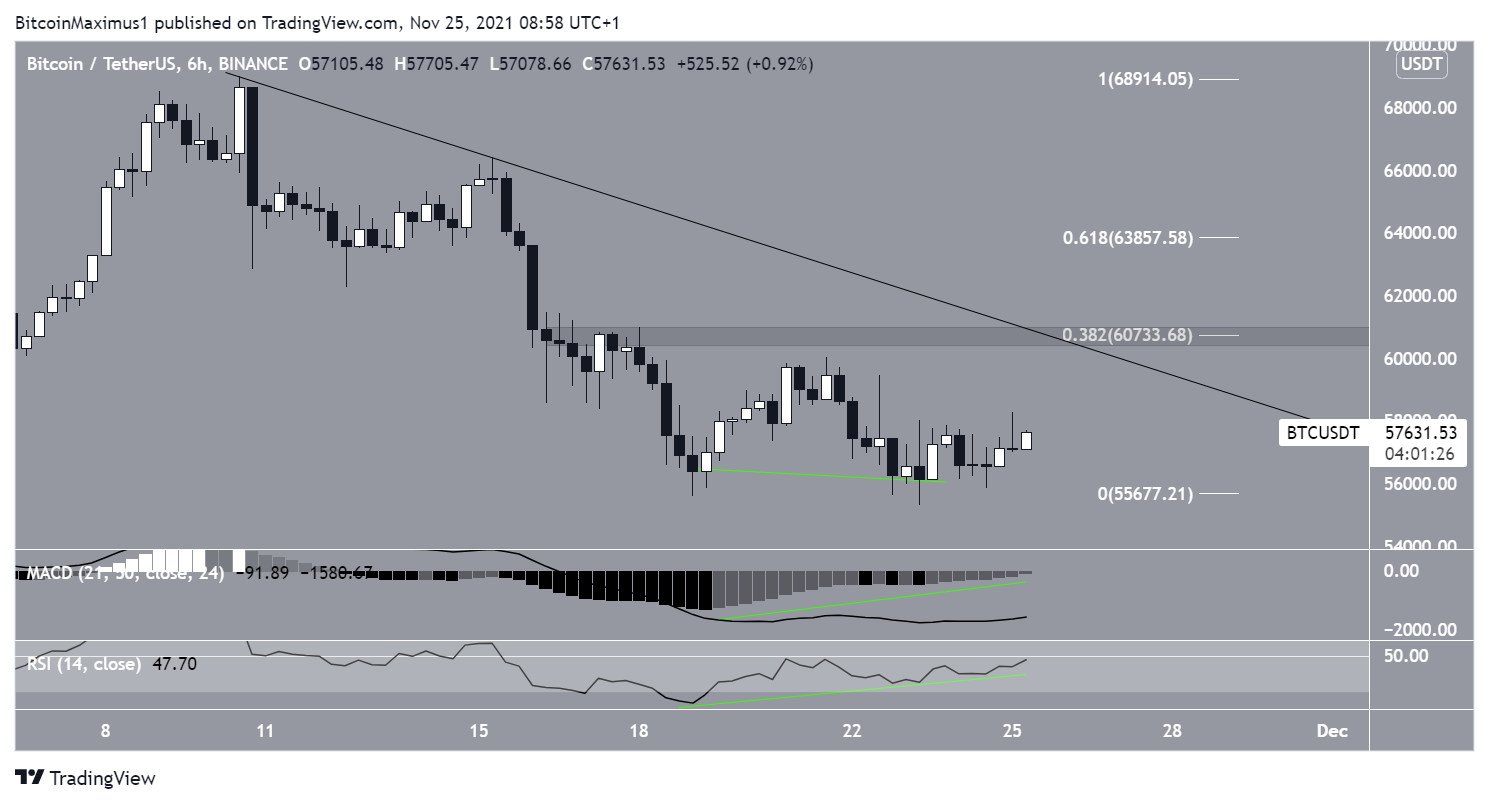
Descending resistance line
The six-hour chart is decisively bullish. It shows that BTC has created a double bottom pattern, which is often considered to be a bullish pattern. In addition to this, there is a very pronounced bullish divergence (green) in both the RSI and MACD.
Therefore, BTC is likely to continue its reversal, at least in the short term.
There is a strong resistance level at $60,733 that also coincides with a descending resistance line. It’s also the 0.382 Fib retracement resistance level and a horizontal support area.
Due to the confluence of all these factors, this is a very strong resistance area. Whether BTC breaks out above it or gets rejected will likely determine the direction of the trend.