BeInCrypto looks at on-chain indicators for Bitcoin (BTC). More specifically, the Market Value to Realized Value Ratio (MVRV) is analyzed in order to compare it with previous market cycles.
The MVRV and its derivatives both support the possibility that another upward movement toward a new all-time high will follow.
MVRV reading
The MVRV indicator shows the ratio between the market and realized capitalization of BTC. Therefore, a value of 3 means that the market capitalization value is thrice higher than the realized capitalization value.
As explained in our previous article, the realized cap measures the BTC price at the previous time it transacted, rather than doing it at the current price.
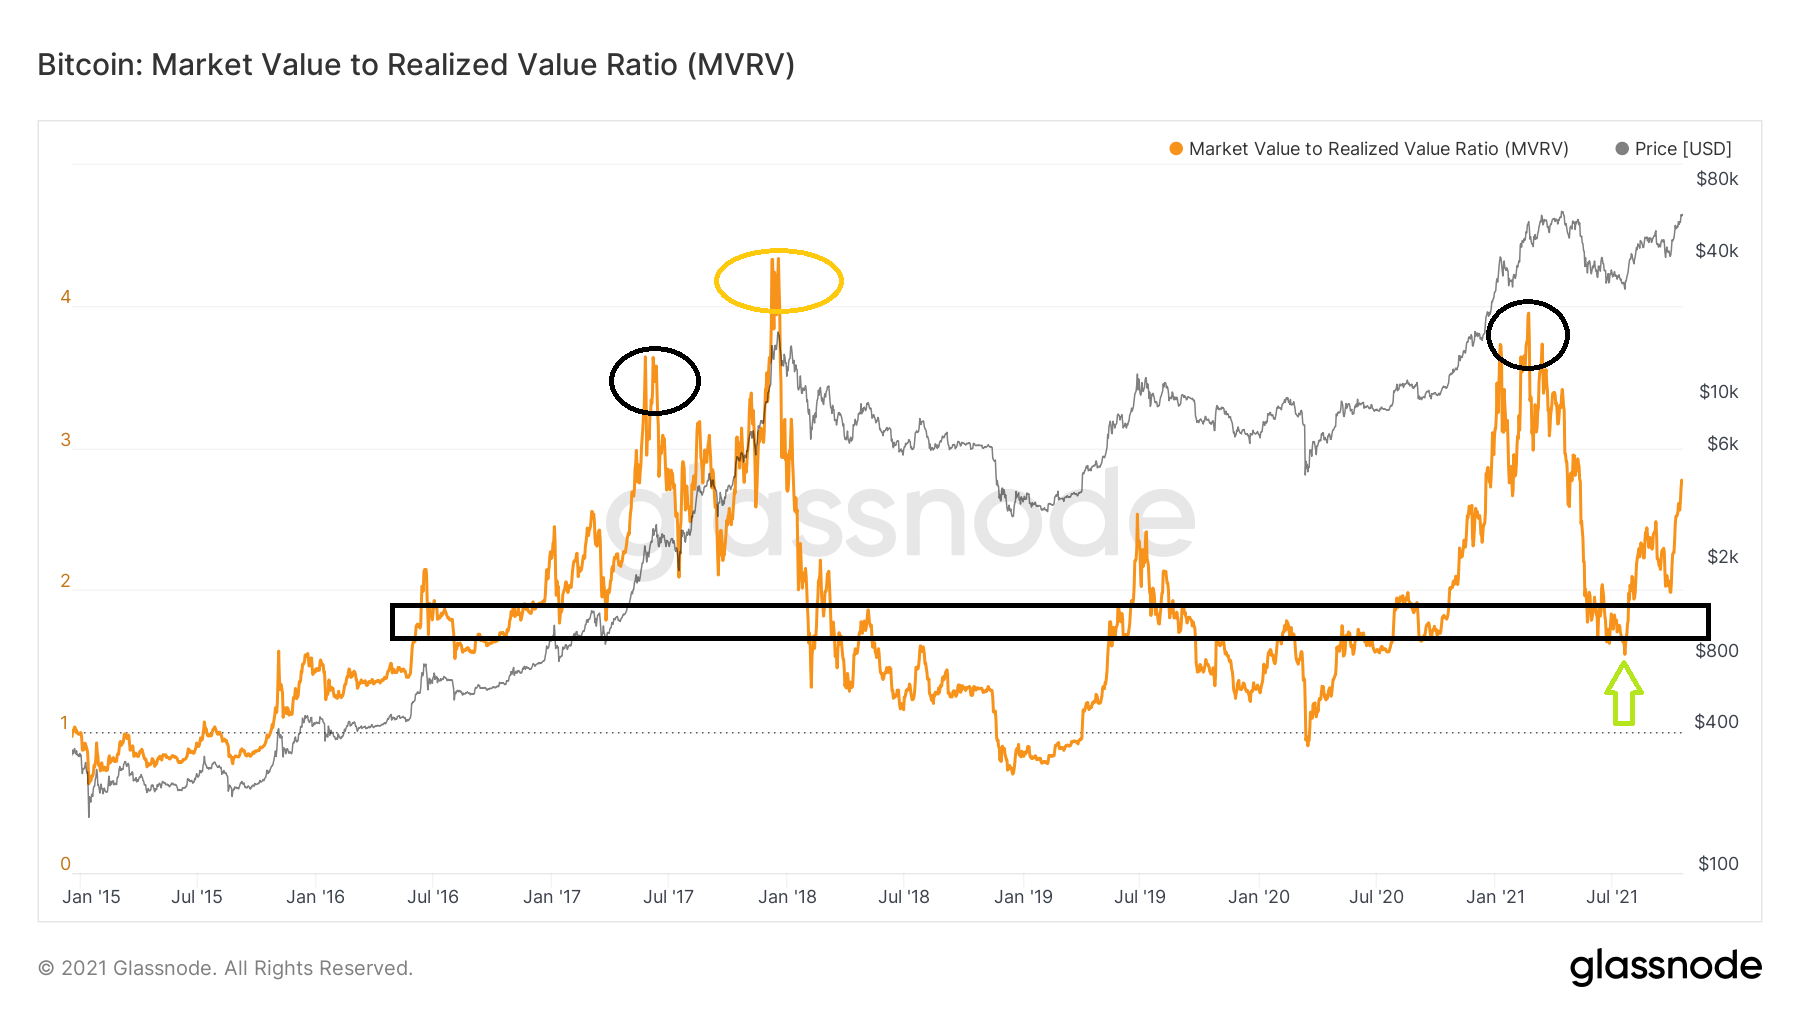
The 1.75 MVRV level has historically acted as a strong support, and has been the catalyst for upward movements. This was the case in the beginning of Sept 2020.
During the July 2021 low, it initially seemed like MVRV would decrease well below this value. However, a strong bounce followed (green arrow), both in the BTC price and in the indicator. Since this is a crucial level, the ensuing bounce was a sign that the upward trend is still intact.
In the 2017 upward movement, MVRV reached a high just below 4 (black circle) before dropping sharply. However, it initiated another upward movement afterwards, leading to a new all-time high value of 4.33 (yellow circle).
In the current movement, the MVRV high was just below four, very similar to the first one in 2017. It remains to be seen if a higher high will transpire in both BTC and the indicator.
Z-Score
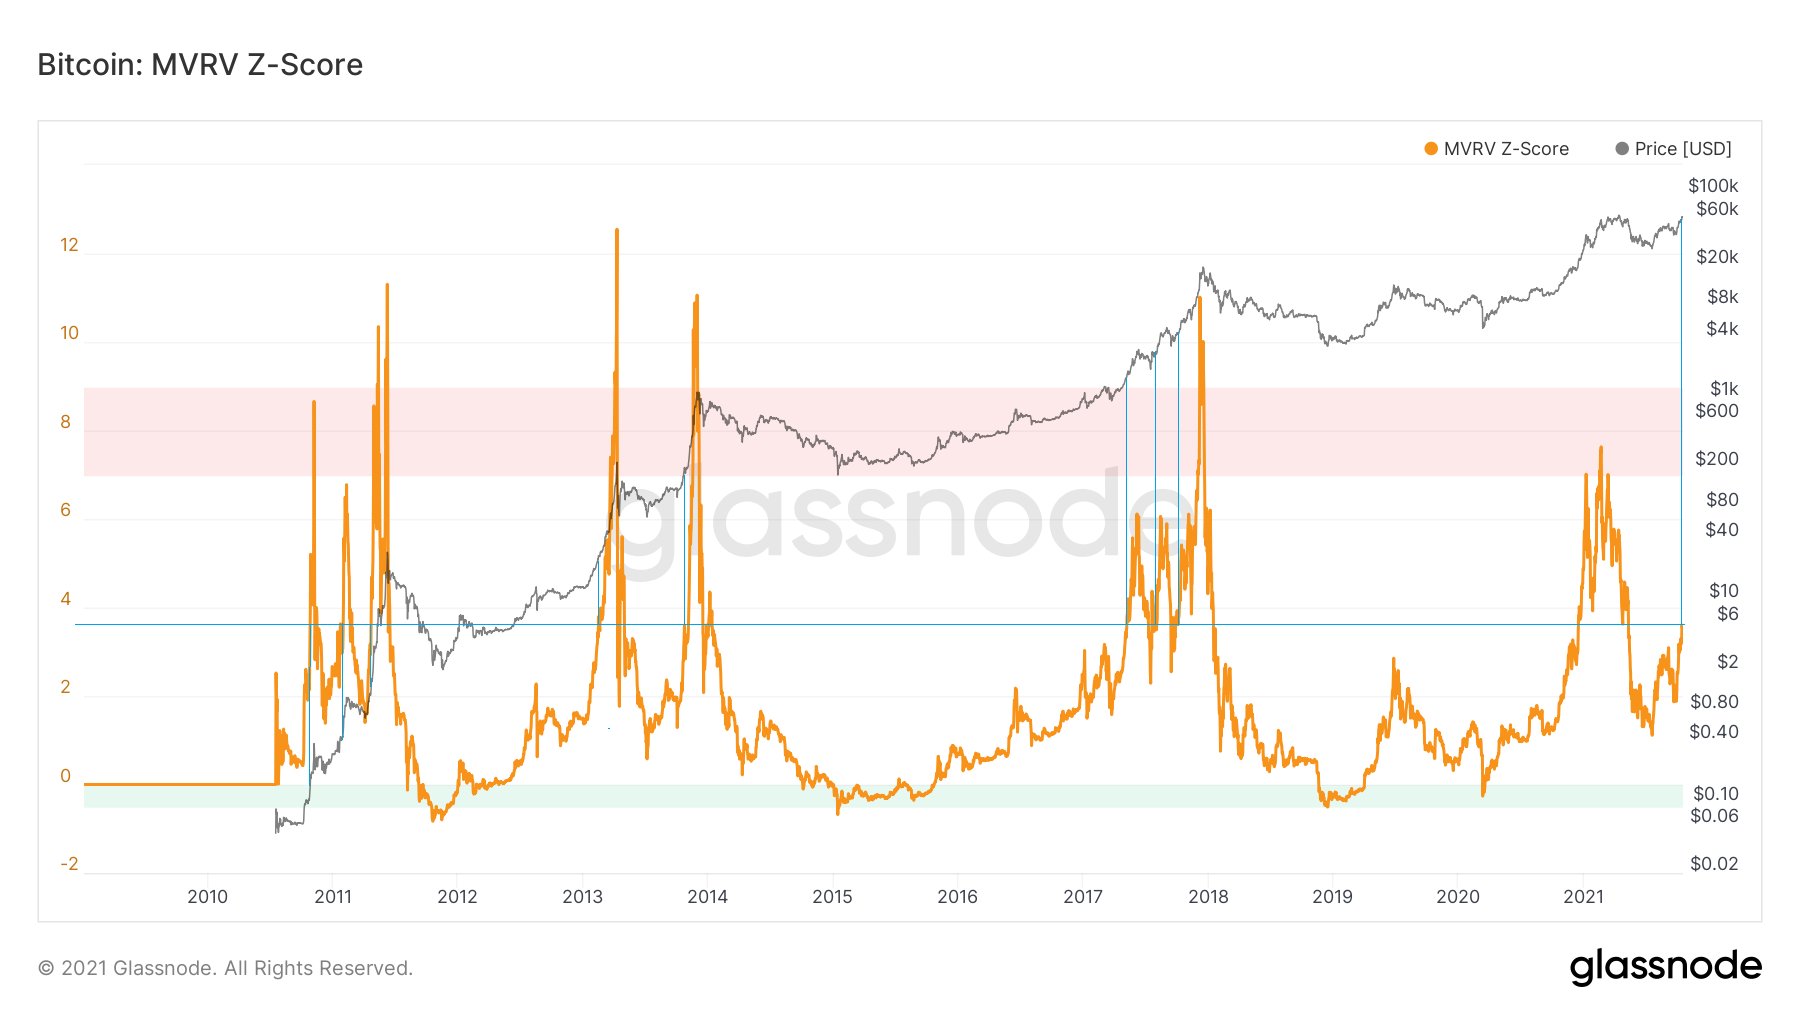
The MVRV Z-Score is a derivative of the on-chain MVRV indicator. It makes use of a standard deviation in order to divide the original value.
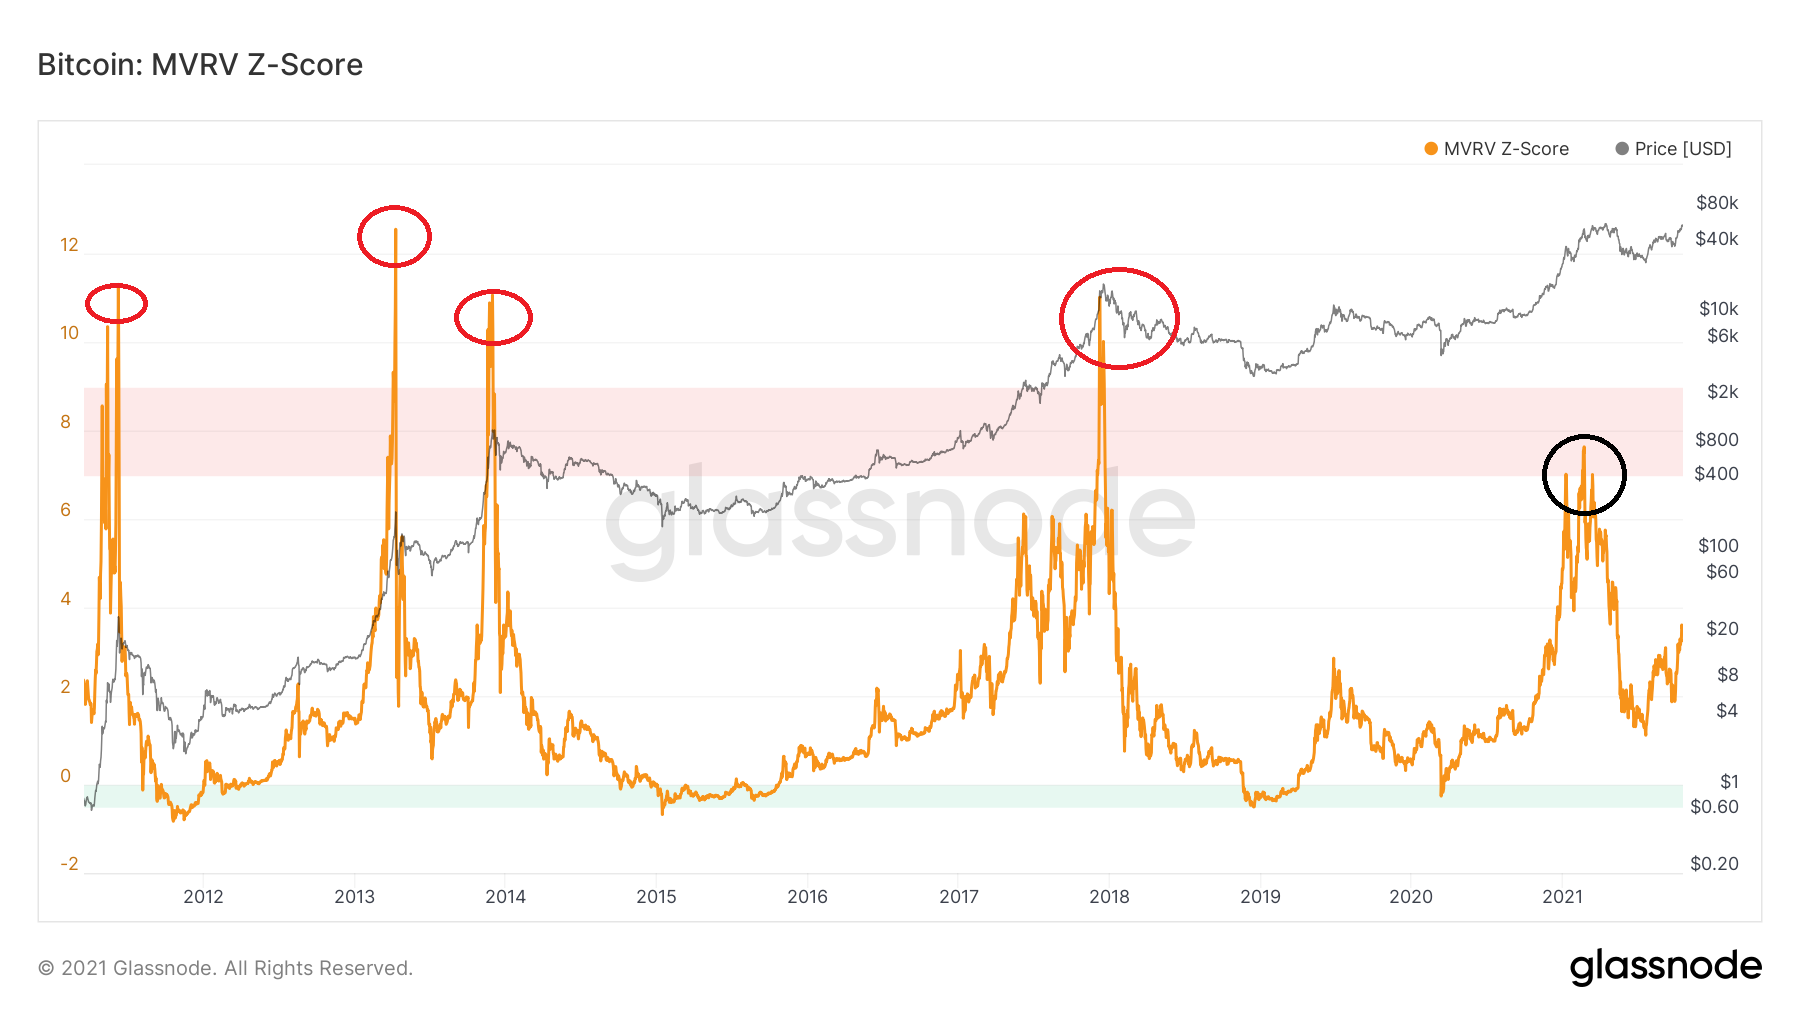
Historically, the region between 7-9 has been associated with tops. This means that the realized value is between 7 and 9 standard deviations higher than the market capitalization.
The 2021 top had a value of 7.63. This was considerably lower than the previous market cycle tops, which all had values above 9.
Bitcoin enthusiast @capriioleio tweeted a MVRV Z-score chart. He stated that each time the 3 area is reclaimed, a significant upward movement ensues. This occurred three times in 2017, and is in alignment with the MVRV readings from the previous section.