Synthetix is a decentralized finance (DeFi) protocol that provides on-chain exposure to a wide variety of crypto and non-crypto assets. The protocol is based on the Ethereum (ETH) blockchain and offers users access to highly liquid synthetic assets (synths). Synths track and provide returns on the underlying asset without requiring one to directly hold the asset.
The platform aims to broaden the cryptocurrency space by introducing non-blockchain assets, providing access to a more robust financial market. Let us see how the technical analysis for SNX looks today.
Past Performance
On July 3, 2021, SNX started trading at $6.713. As of June 4, 2021, the closing price of SNX was $8.373. Thus, in the past week, the SNX price has increased by 17.24%. In the last 24 hours, SNX has traded between $8.475 – $8.412.
https://www.tradingview.com/x/JOZPPUqd/
Day Ahead And Tomorrow
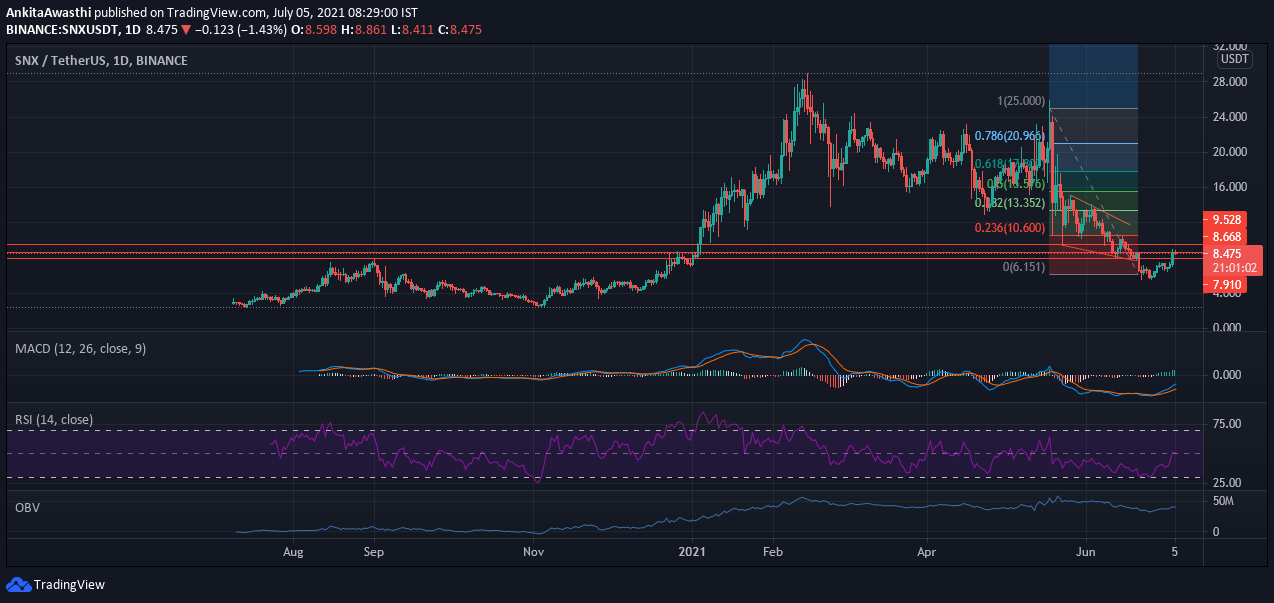
Currently, SNX is trading at $8.462. The price has slightly reduced from the opening of $8.470. Thus, the market is a little down, but we need to see the other indicators along to draw a conclusion.
The MACD and signal lines are in the negative zone. Plus, a bearish crossover by the MACD line over the signal line has occurred. Thus, the overall market momentum is bearish, and we can expect a price pullback. However, both the lines are close to the zero lines and may change signs soon. If buying pressure takes over the selling pressure, we might witness a clear breakout on the upside for SNX
The RSI indicator is at 38%. It has fallen from the 59% mark. Thus, it indicates that the selling pressure is high in the market. Hence, we can expect the price to fall for some time.
The price has tested and fallen below the Fibonacci pivot point of $8.668. As some of the oscillators have shown bearish signals, we can expect the price to fall and test the first Fibonacci pivot support level of 8.472 soon.
SNX Technical Analysis
The price has been tested and is currently trading below the 38.2% FIB retracement level of $8.473. If the price falls below the 23.6% FIB extension level of $7.910 in some time, this implies that the price downtrend is strong. In that case, the price downswing is likely to continue for few hours.
However, if the price tests and rises above the 38.2% FIB retracement level of $8.633. It can test the 50% FIB retracement level of $7.911.