Dogecoin (DOGE) has been moving downwards since reaching an all-time high price on May 8.
While it bounced and has broken out from a descending resistance line, the bullish trend reversal has yet to be confirmed.
DOGE drops after all-time high
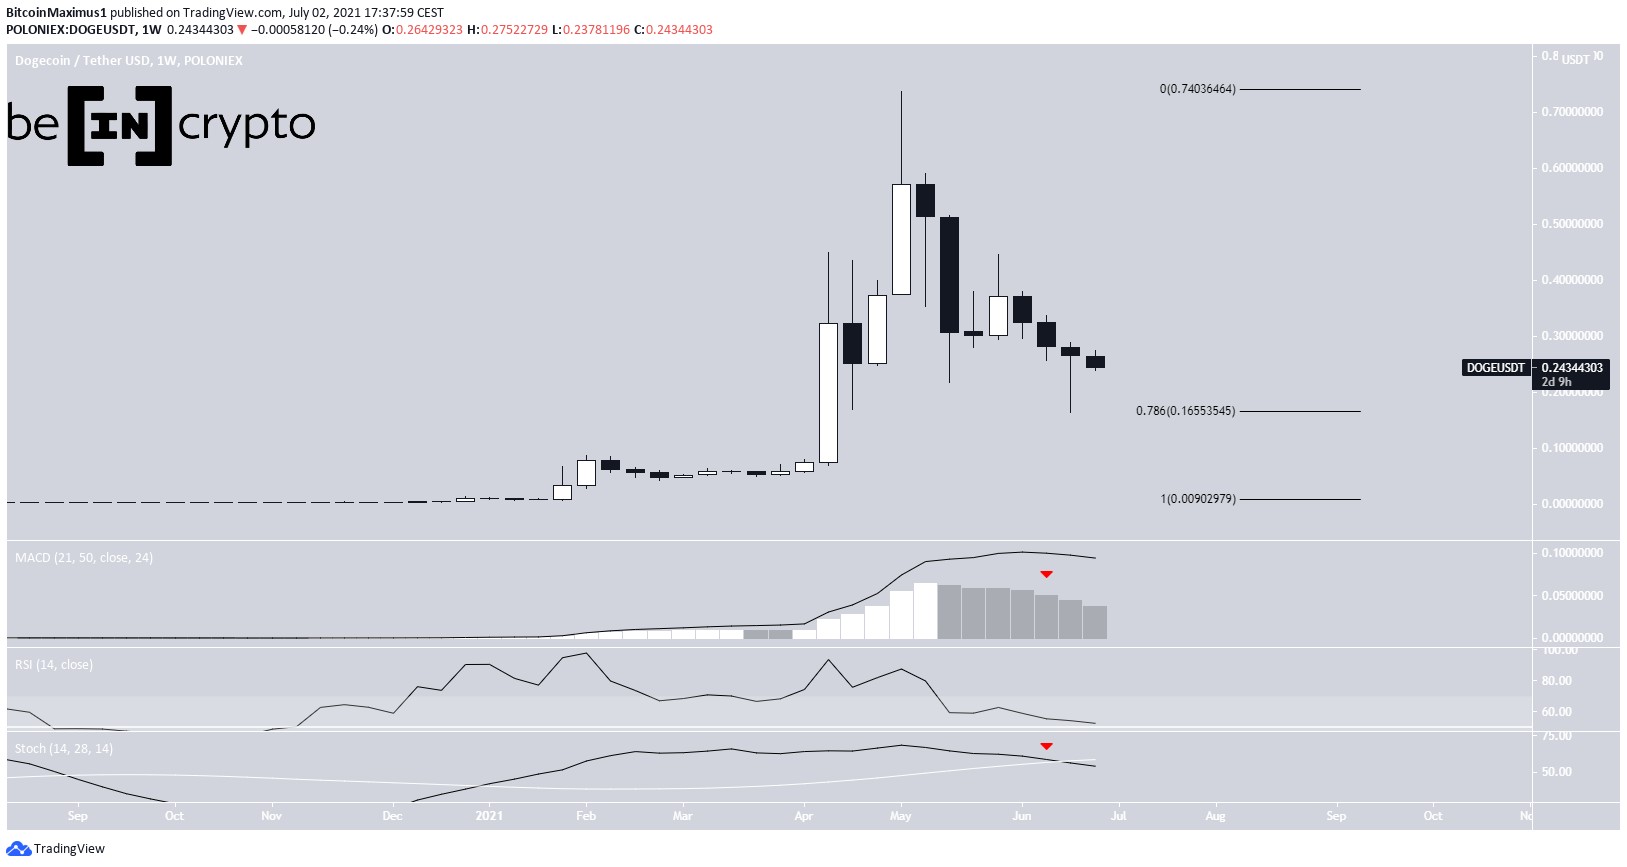
DOGE reached an all-time high price of $0.737 on May 8. This was the culmination of a very significant bull run, in which the token increased by 54,890%.
DOGE has been moving downwards since. So far, it has reached a low of $0.163, doing so on June 21. The low was made right at the 0.786 Fib retracement support level. A bounce ensued afterwards, leaving a long lower wick in place.
Despite the bounce, technical indicators are bearish. The MACD has given a bearish reversal signal, while the Stochastic oscillator has made a bearish cross (red icons).
Reversal attempt
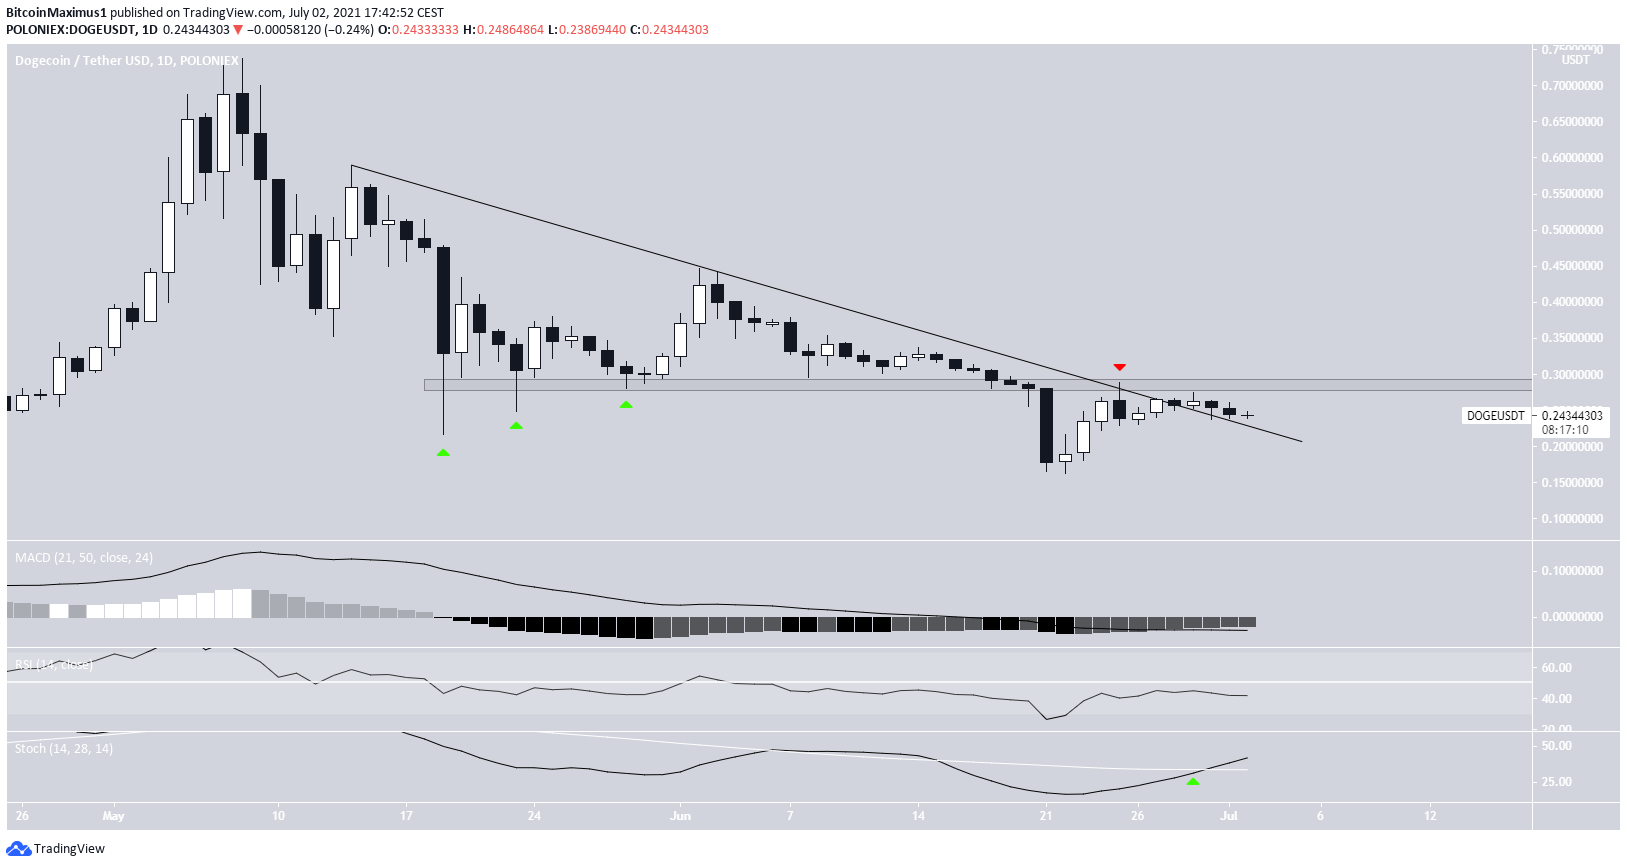
The daily chart provides a slightly more bullish picture. While DOGE had been following a descending resistance line since May 14, it managed to break out on June 29. In addition to this, the Stochastic oscillator has made a bullish cross
However, the token was rejected by the $0.285 horizontal area. The area previously acted as support (green icons) and has now turned to resistance (red icon).
Until the area is reclaimed, the intermediate trend cannot be considered bullish. Furthermore, the RSI is below 50 and the MACD has yet to cross into positive territory.
Wave count
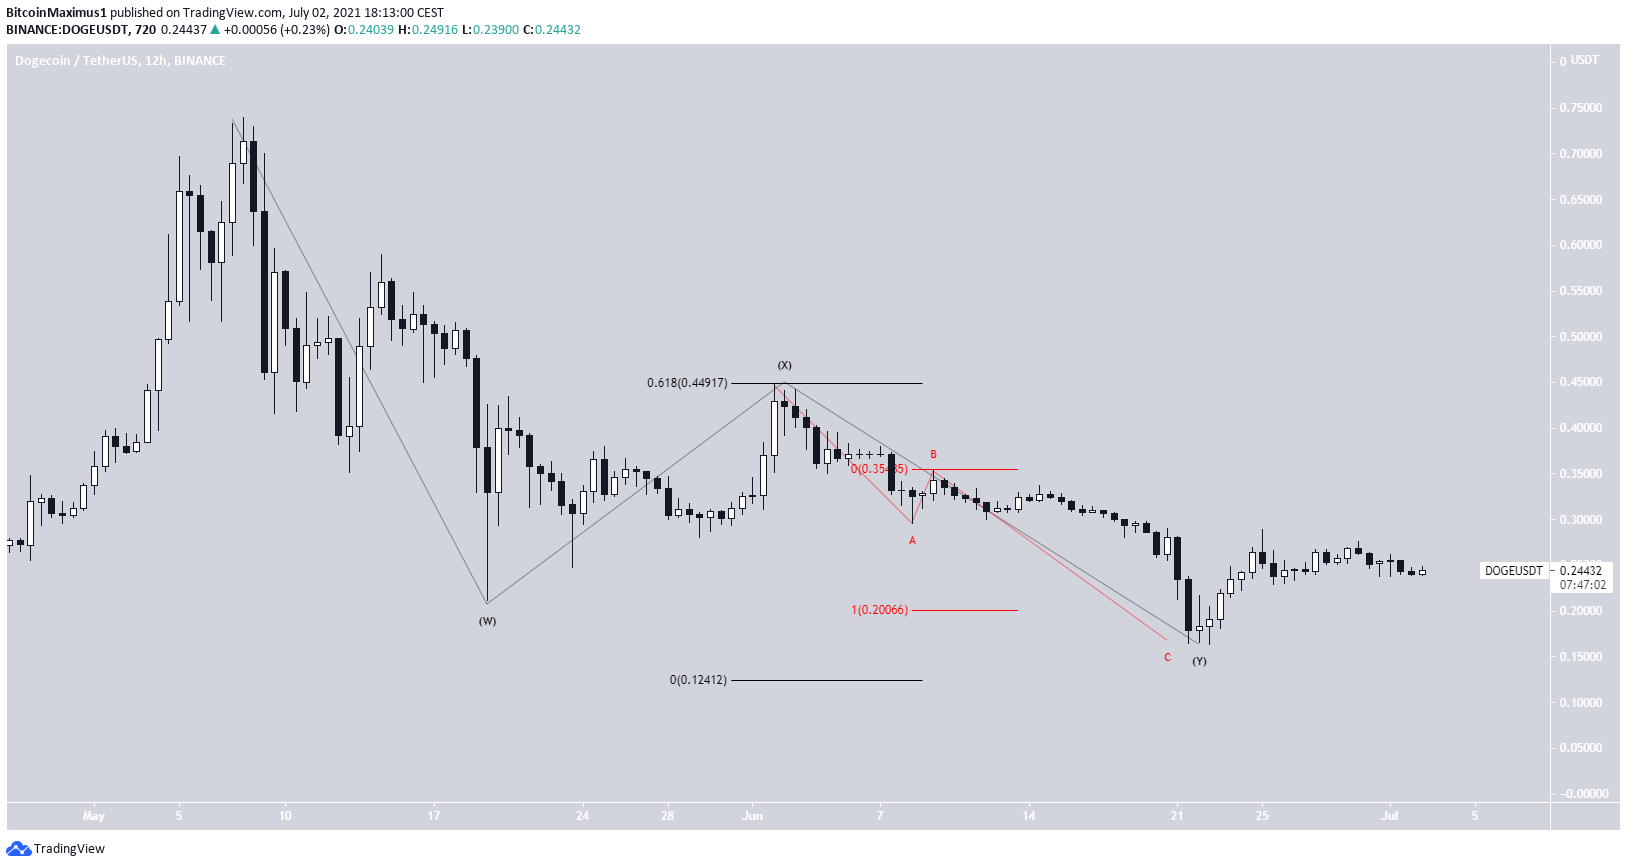
Cryptocurrency trader @GregHorvatFX outlined a DOGE chart, stating that the token is approaching an important level of Fib confluences which could act as the bottom of the correction.
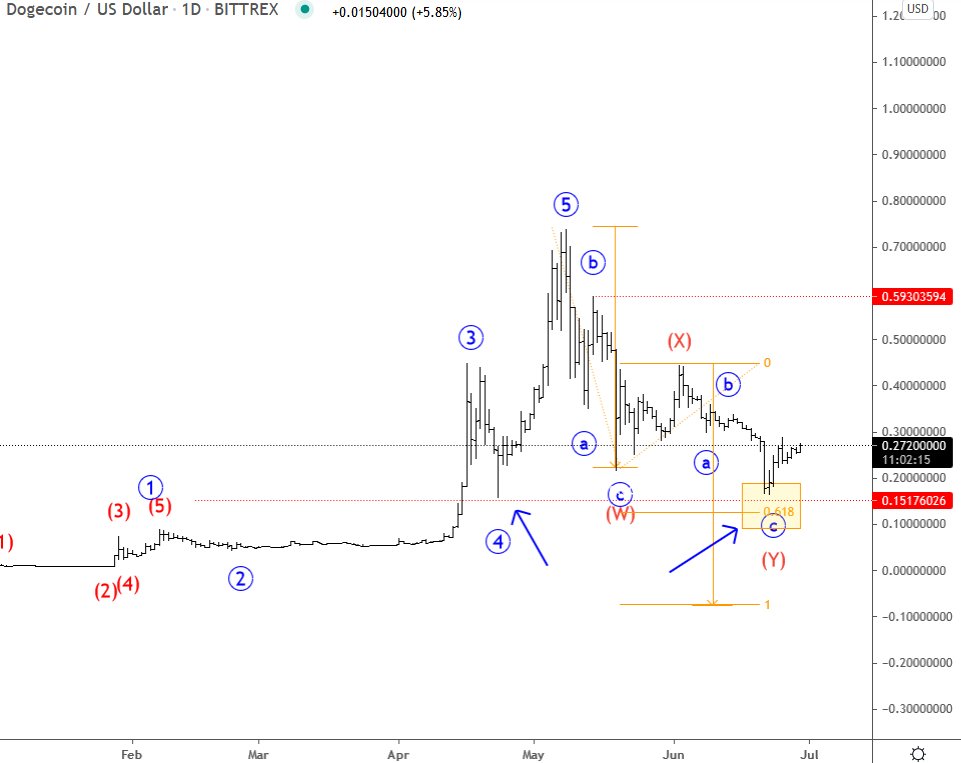
If the decrease is indeed a complex, W-X-Y structure, it seems more likely that another low will eventually follow.
Giving waves W:Y a 1:0.61 ratio would lead to a low of $0.124 (black), considerably lower than the $0.165 low that has been reached so far.
In addition to this, sub-waves A:C (red) do not have a clear similarity in length, since wave C is longer than 1:1 of A, but shorter than 1:1.61 of it.
Therefore, unless DOGE reclaims the $0.285 area, we cannot consider the trend bullish.