BeInCrypto takes a look at the seven altcoins that increased the most over the past seven days, from June 25 to July 2.
These altcoins are:
- XinFin Network (XDC) : 53.55%
- Compound (COMP): 28.16%
- Celo (CELO) : 24.63%
- Decred (DCR) : 20.85%
- Elrond (EGLD) : 20.56%
- Internet Computer (ICP): 19.41%
- Ethereum Classic (ETC) : 17.43%
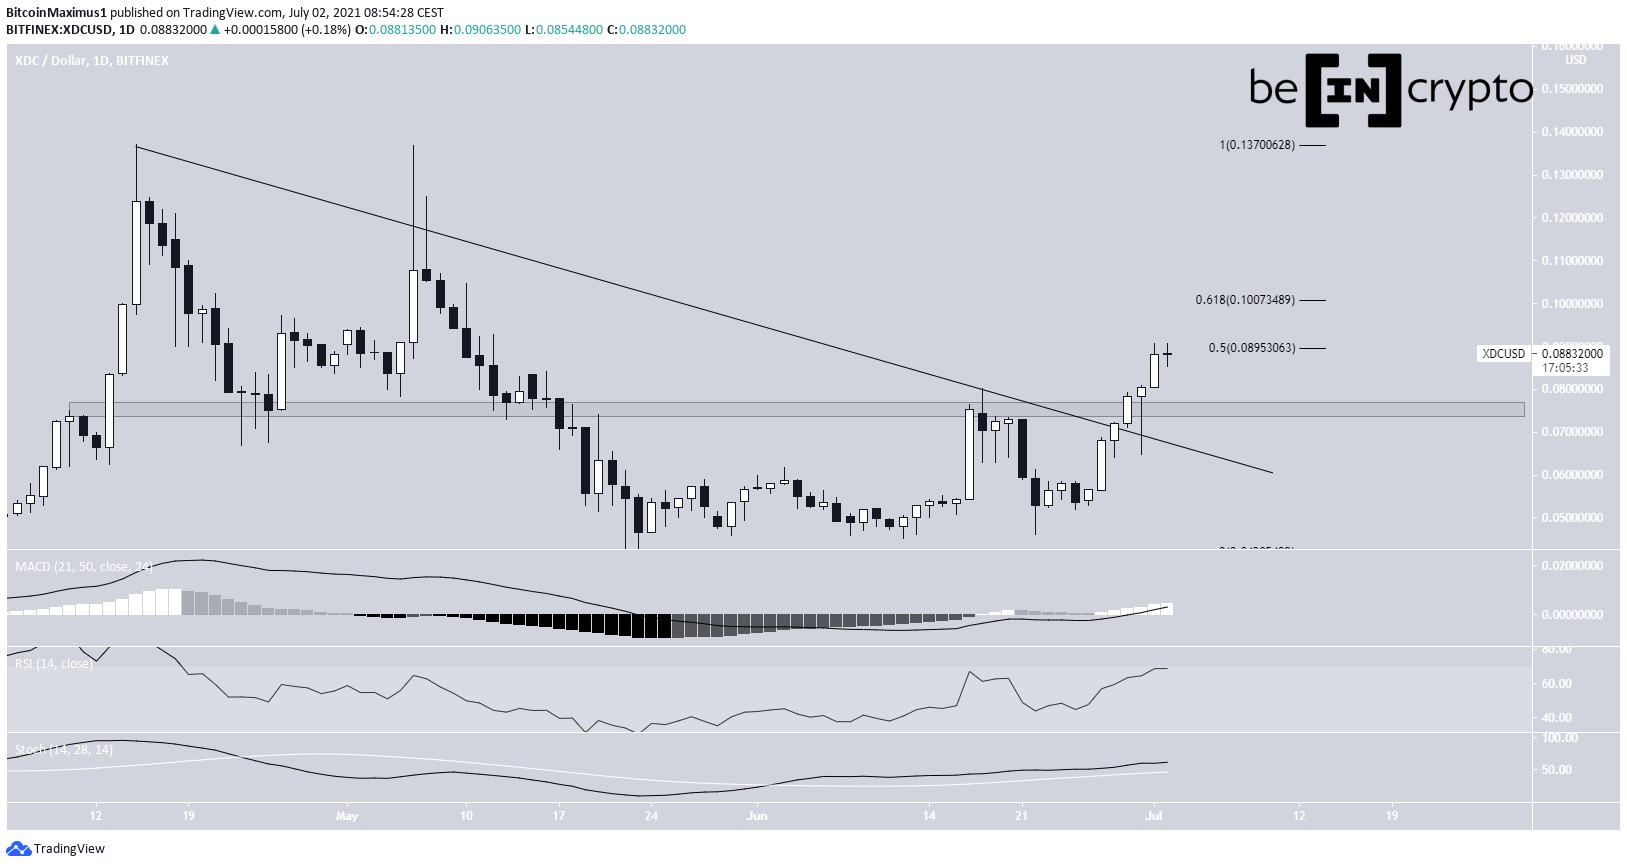
XDC
XDC had been decreasing alongside a descending resistance line since April 15 after it reached a high of $0.137.
After two unsuccessful breakout attempts, XDC was successful in moving above this line on June 29. In addition, it moved above the $0.075 horizontal support area.
Technical indicators are bullish, supporting the continuation of the upward movement.
However, XDC is currently trading inside the 0.5-0.618 Fib retracement resistance area, between $0.089-$0.10.
Even if the trend is bullish, some type of rejection at this area could occur, leading to a retest of the $0.075 support area and potentially a higher low.
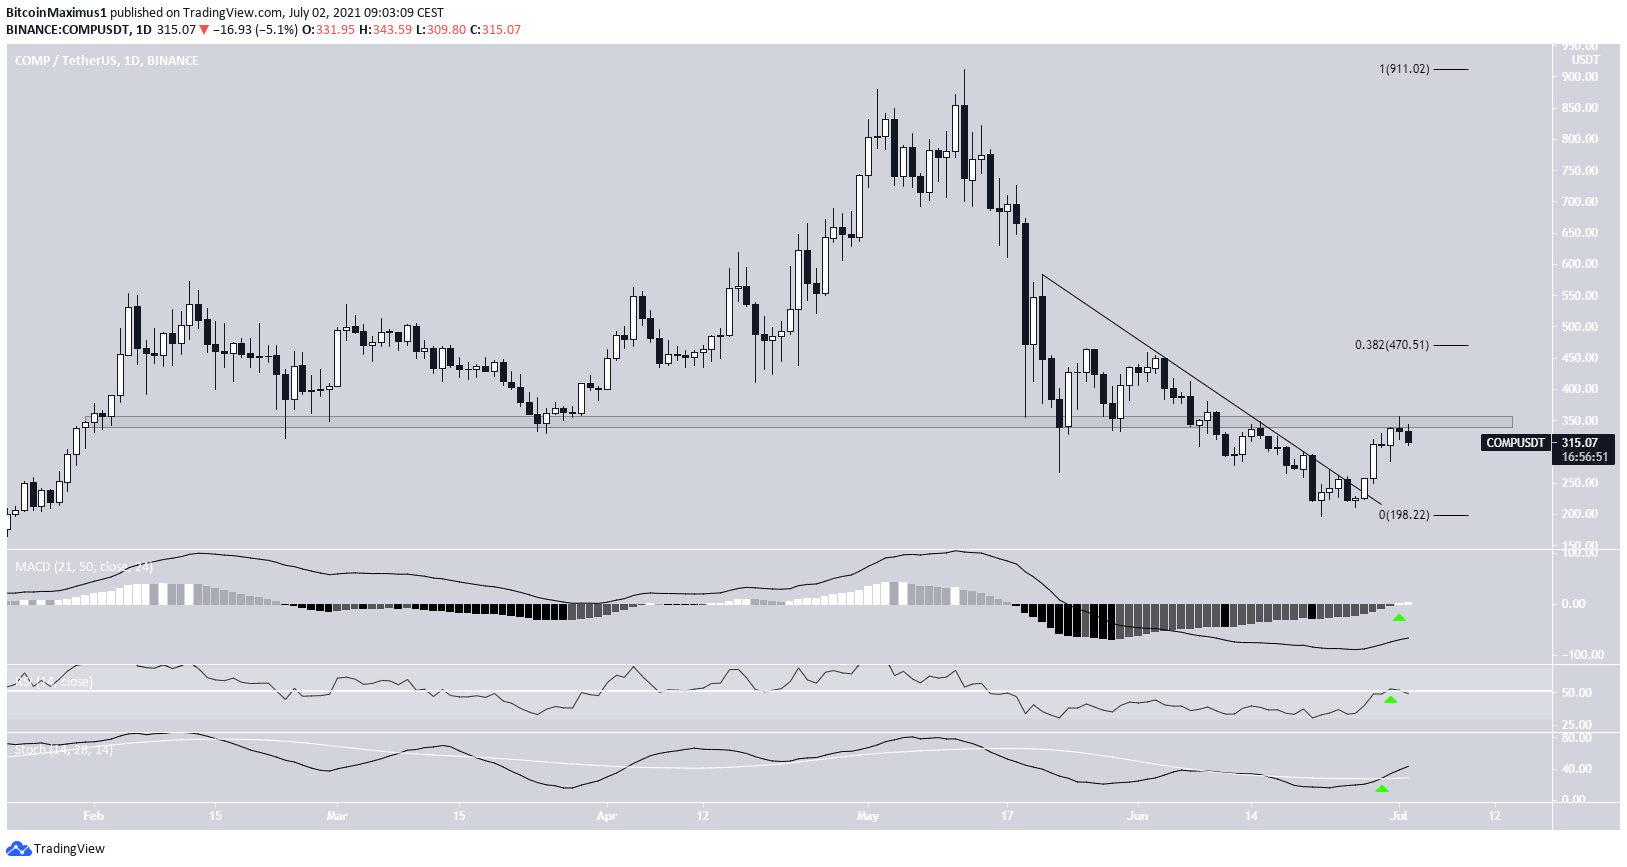
COMP
On May 23, COMP reached a low of $267.55 and bounced. The bounce validated the $350 horizontal area as support.
However, COMP was rejected by a descending resistance line and broke down from the area after.
Currently, it’s in the process of validating the horizontal line as resistance.
There are numerous bullish signs in place, such as the bullish cross in the Stochastic oscillator, RSI movement above 50, and the positive MACD histogram. Despite this, COMP is still facing resistance from the $350 area.
Until it’s successful in moving above it, the trend cannot be considered bullish. The next resistance target is found at $470.
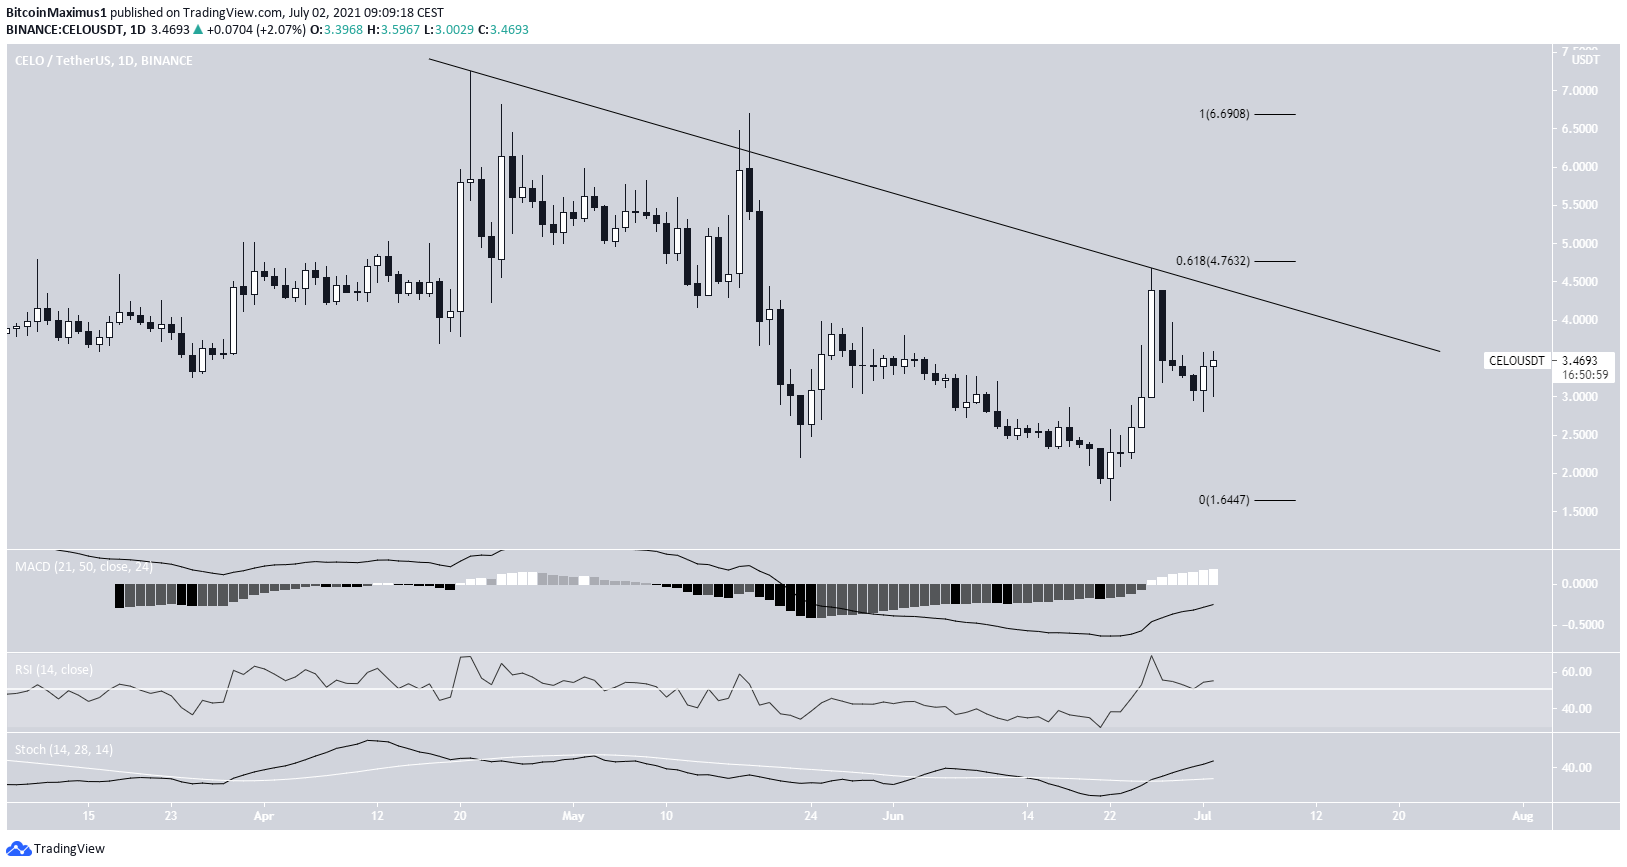
CELO
CELO has been decreasing alongside a descending resistance line since April 21, after it reached a high of $7.25.
So far, it has reached a low of $1.65, on June 22. The upward movement that followed took CELO back to this descending resistance line on June 26.
However, it was again rejected by the line, which at the time coincided with the 0.618 Fib retracement resistance level.
Technical indicators are bullish, indicating that an eventual breakout is likely.
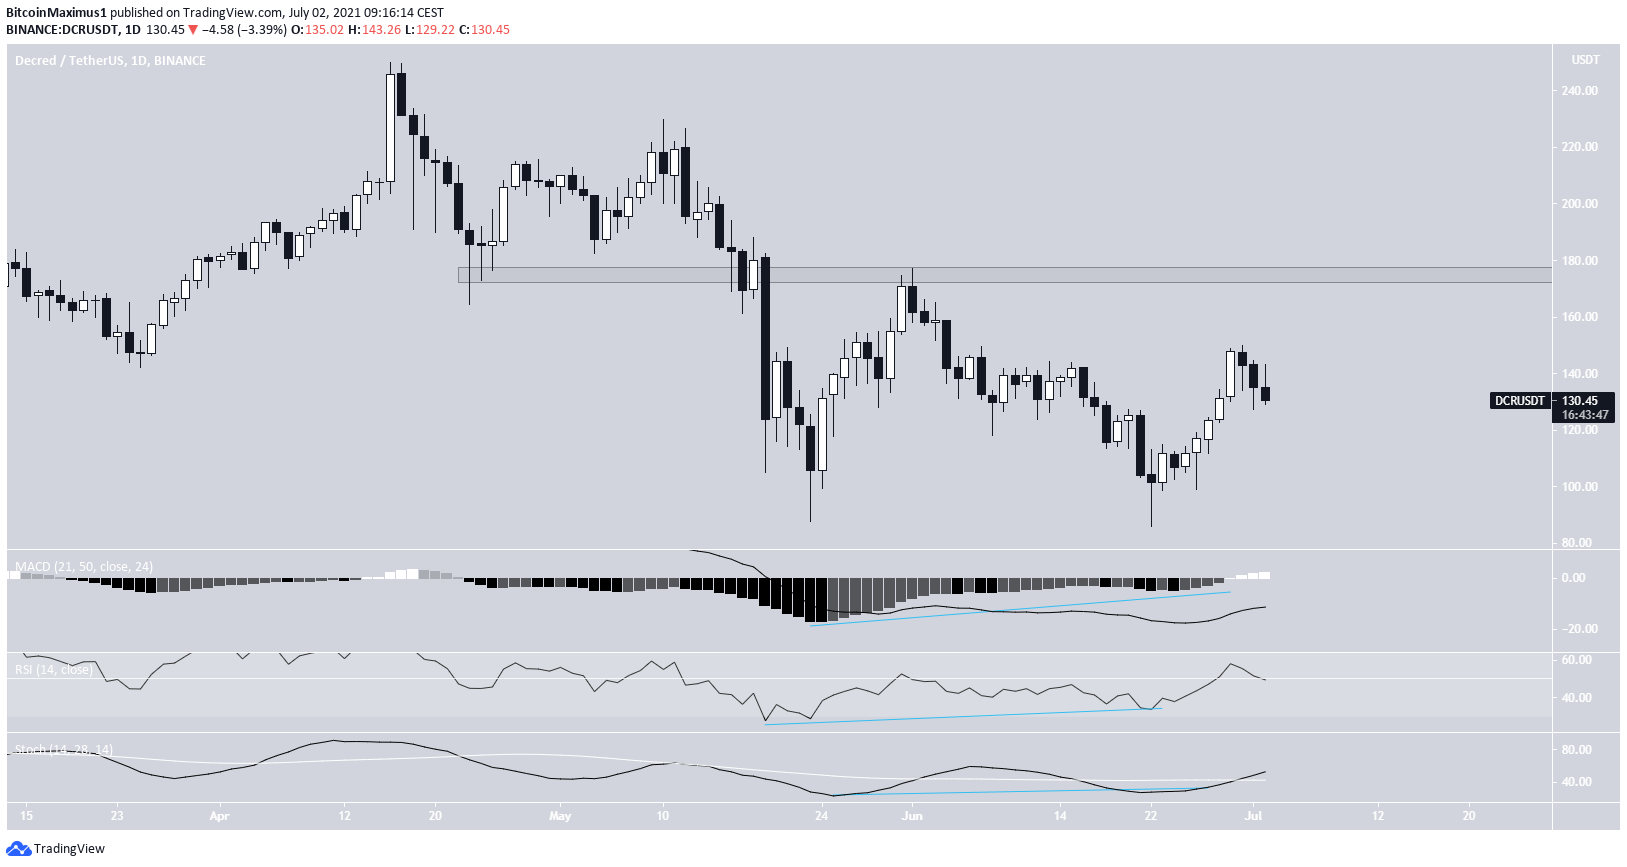
DCR
On May 23 and June 22, DCR created a double bottom pattern near the $85 support area. The double bottom is known as a bullish reversal pattern.
In addition, it was combined with a bullish divergence in the MACD, RSI, and Stochastic oscillator.
Since completing the second bottom on June 22, DCR has been moving upwards. The closest resistance area is found at $175.
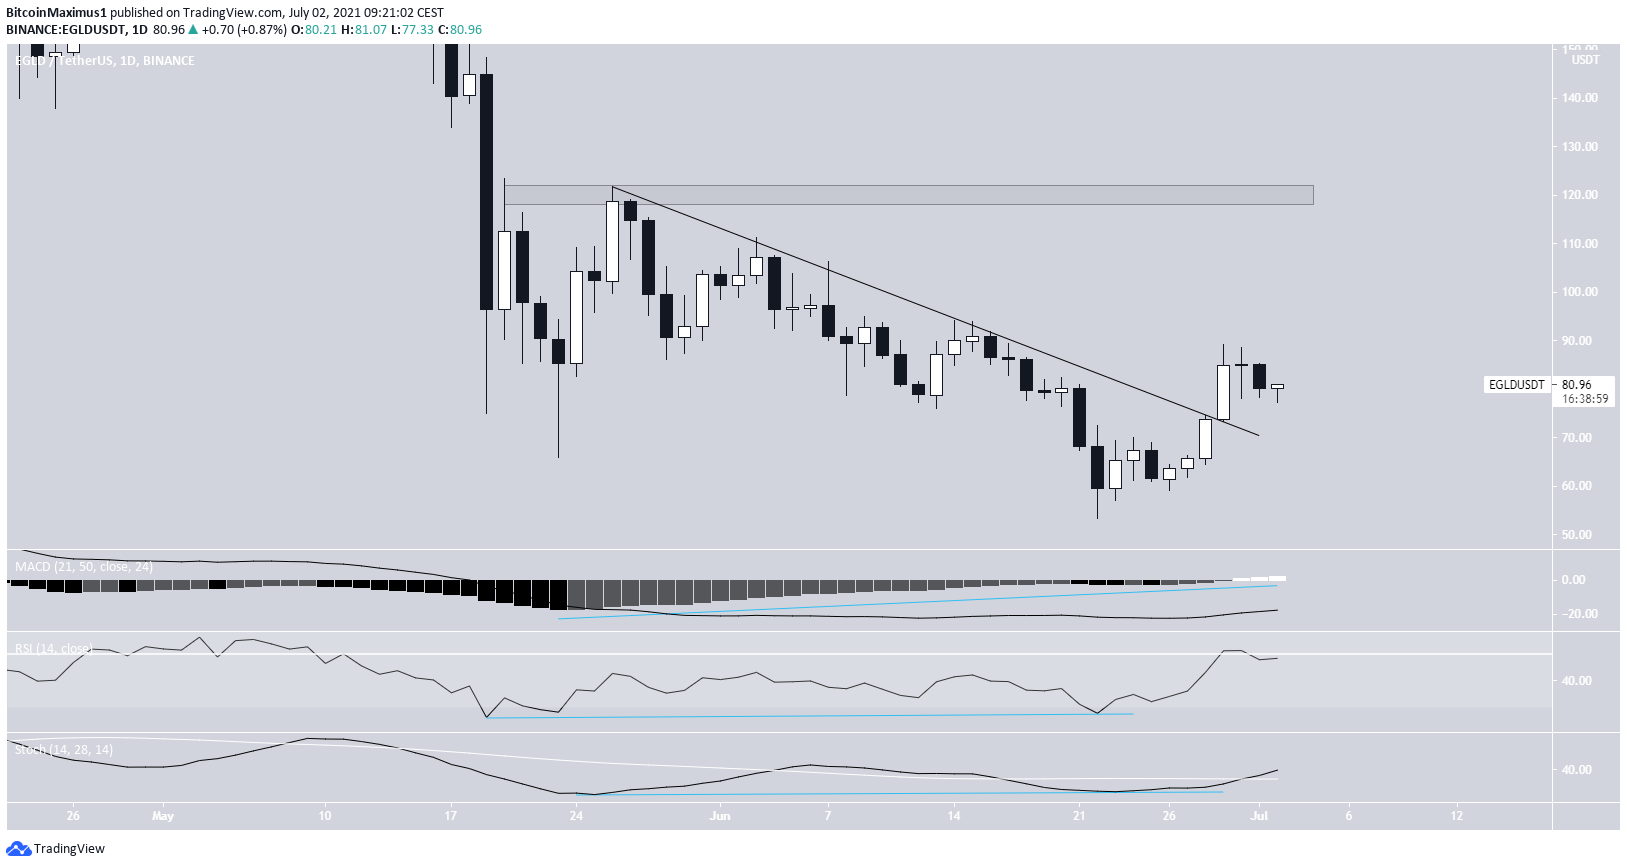
EGLD
EGLD has been decreasing alongside a descending resistance line since May 26. On June 22, it reached a low of $53.41, creating what looks like a double bottom pattern.
Similar to DCR, the pattern was combined with a bullish divergence in the MACD, RSI, and Stochastic oscillator.
Afterward, EGLD broke out from the aforementioned descending resistance line. The closest resistance area is found at $120.
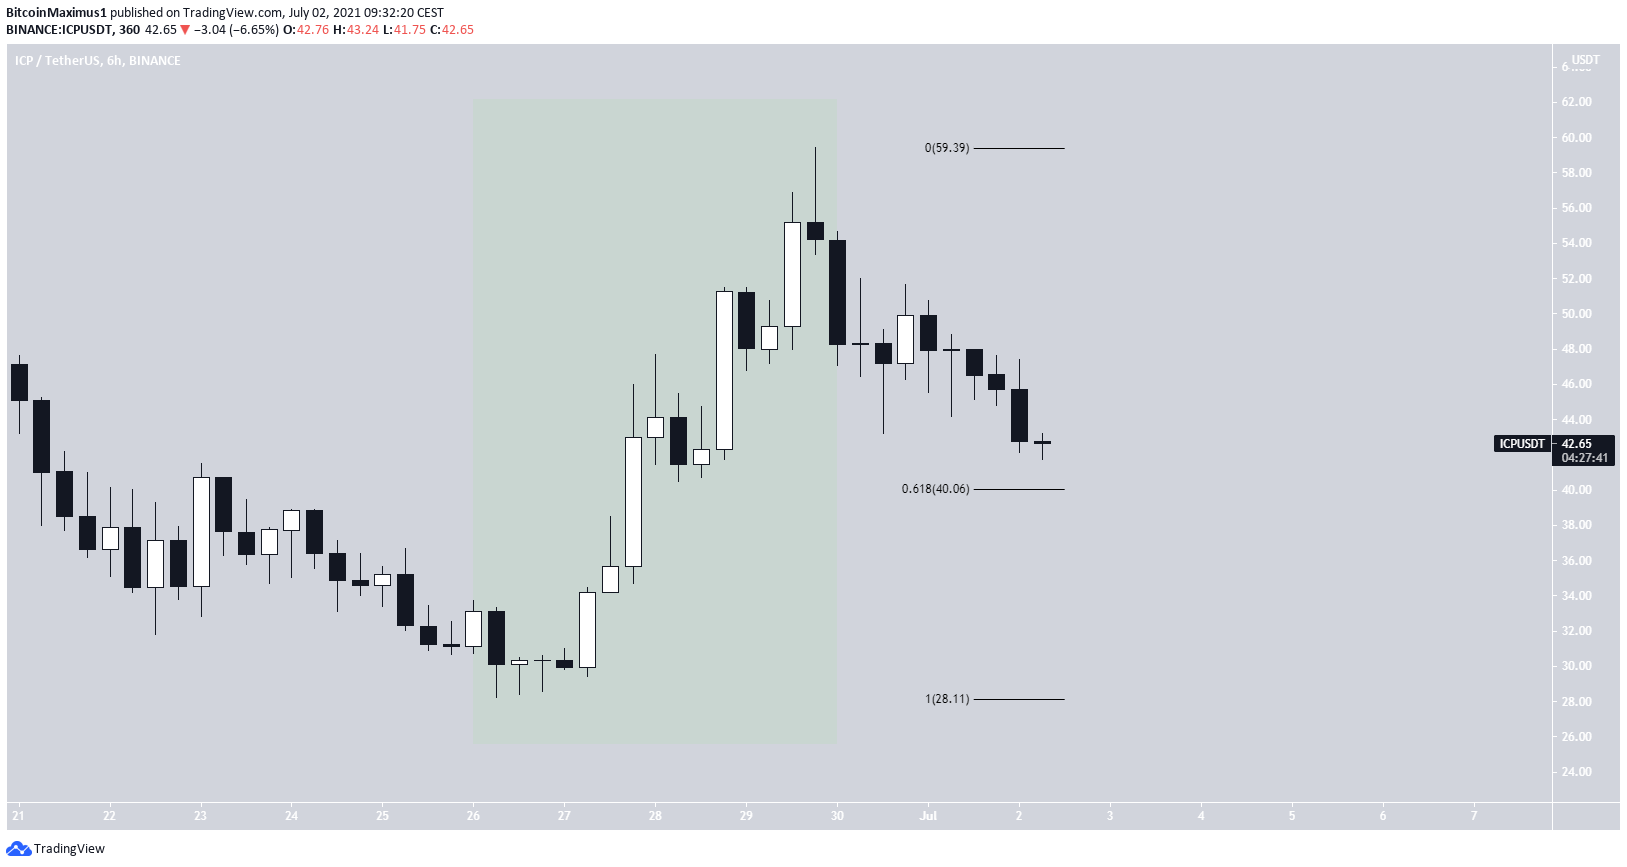
ICP
On June 26, ICP reached an all-time low price of $28.26. It has been increasing since in what seems like an impulsive movement (highlighted in green).
So far, it has reached a high of $59.45 on June 29.
It’s currently trying to find support at the 0.618 Fib retracement support level at $40. It could potentially create a higher low in the process.
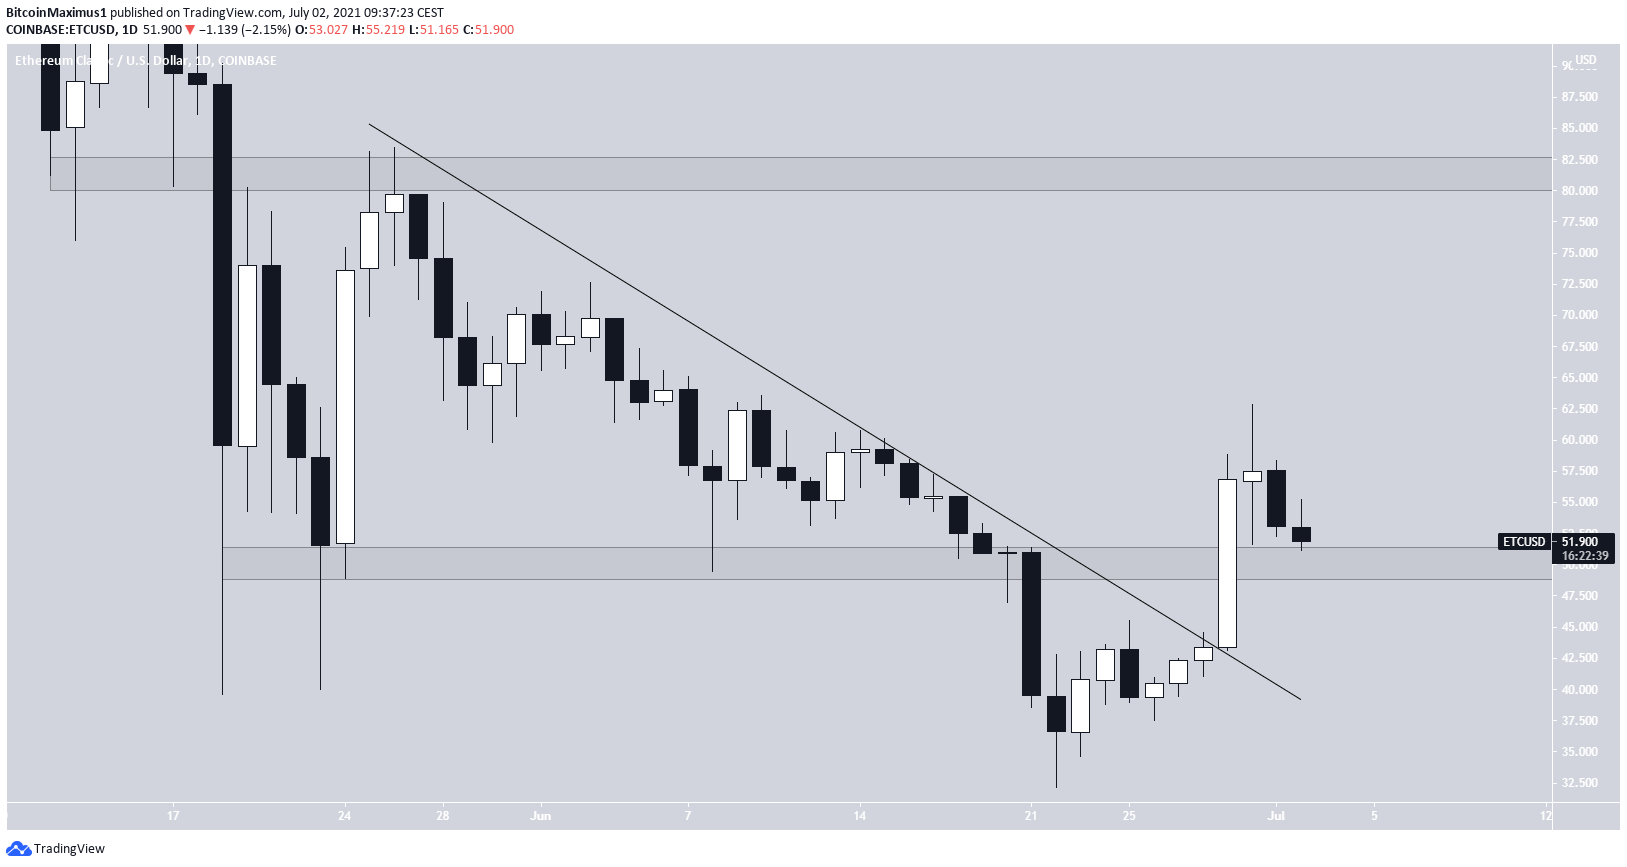
ETC
On June 22, ETC reached a low of $32.17 and has been increasing since. On June 29, it broke out from a descending resistance line and reclaimed the $50 horizontal area.
It’s currently attempting to create a higher low. This is a bullish development that would likely lead to higher prices.
If so, the closest resistance would be found at $82.