In this article, we will take a look at the differences in price movement between Bitcoin (BTC) and Ethereum (ETH), in order to determine which coin will outperform the other in July.
The short-term ETH movement looks more bullish than that of BTC. In addition, the ETH/BTC pair is showing bullish reversal signs, making it more likely that ETH will outperform BTC in July.
Ethereum
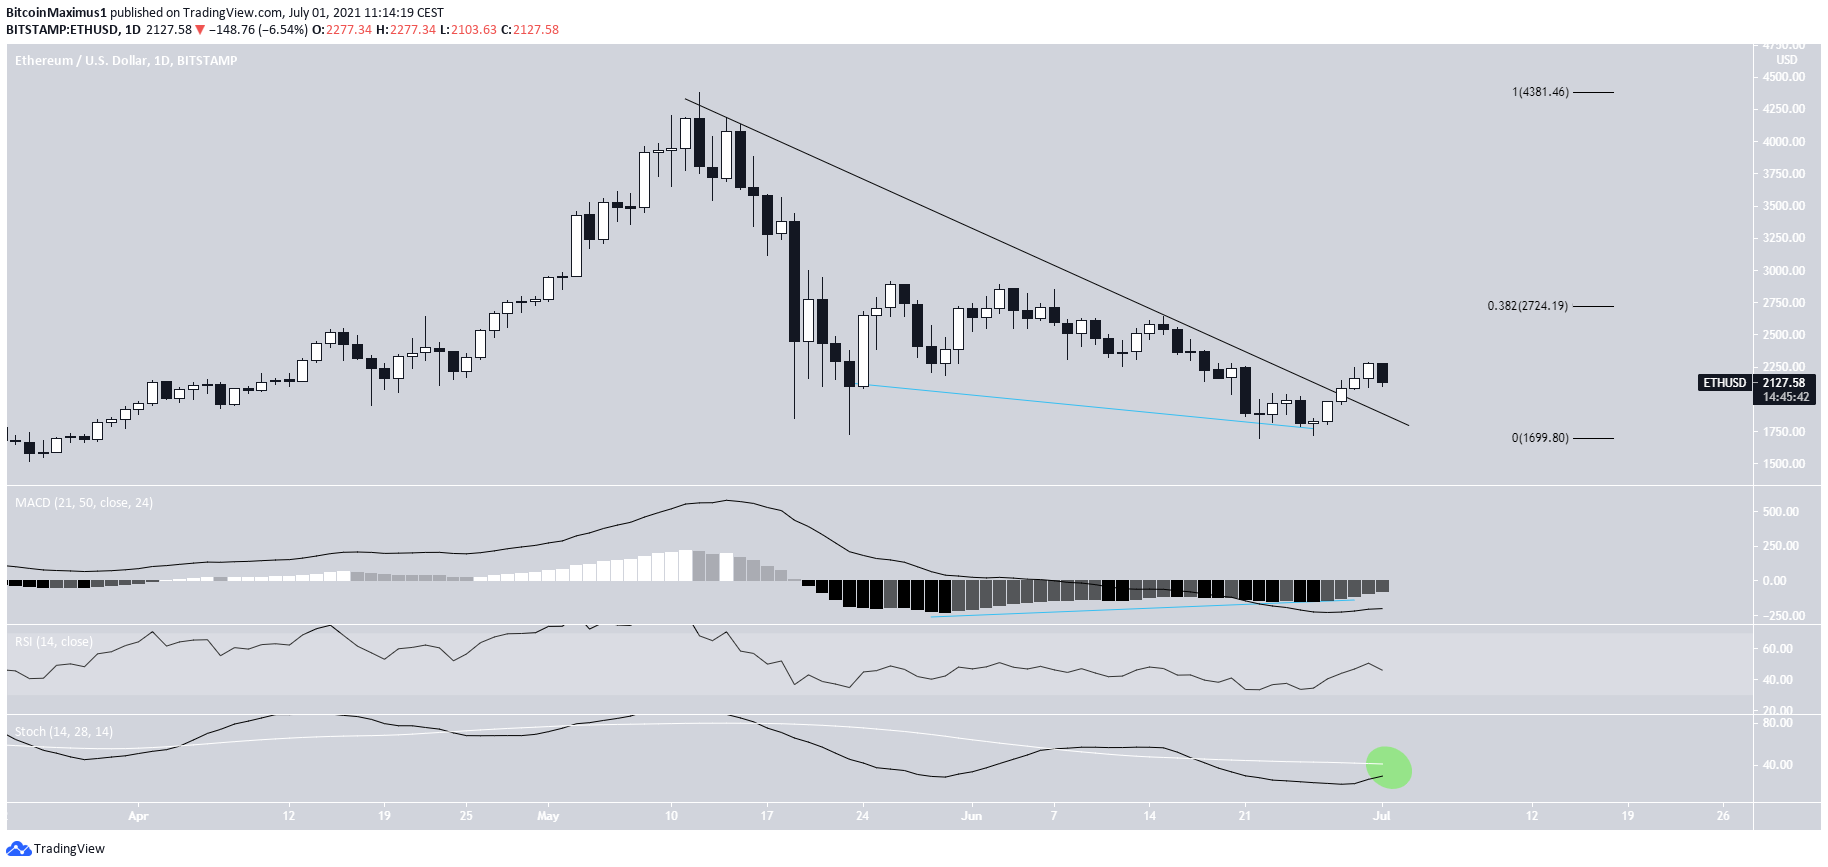
ETH has been decreasing since reaching an all-time high price on May 12. Throughout the decrease, it has been following a descending resistance line.
So far, it has reached a low of $1,730, doing so on May 23. On June 22, it created a double bottom pattern near the same level. This is considered a bullish pattern. In addition, it was combined with bullish divergence in the MACD.
Afterwards, ETH broke out from the aforementioned descending resistance line. It is currently in the process of validating it as support.
The closest resistance is at $2,724, the 0.382 Fib retracement resistance level.
Technical indicators are not bullish yet. The RSI has not crossed above 50, the Stochastic oscillator has yet to make a bullish cross, and the MACD histogram is not positive. These have to occur in order for the trend to be considered bullish.
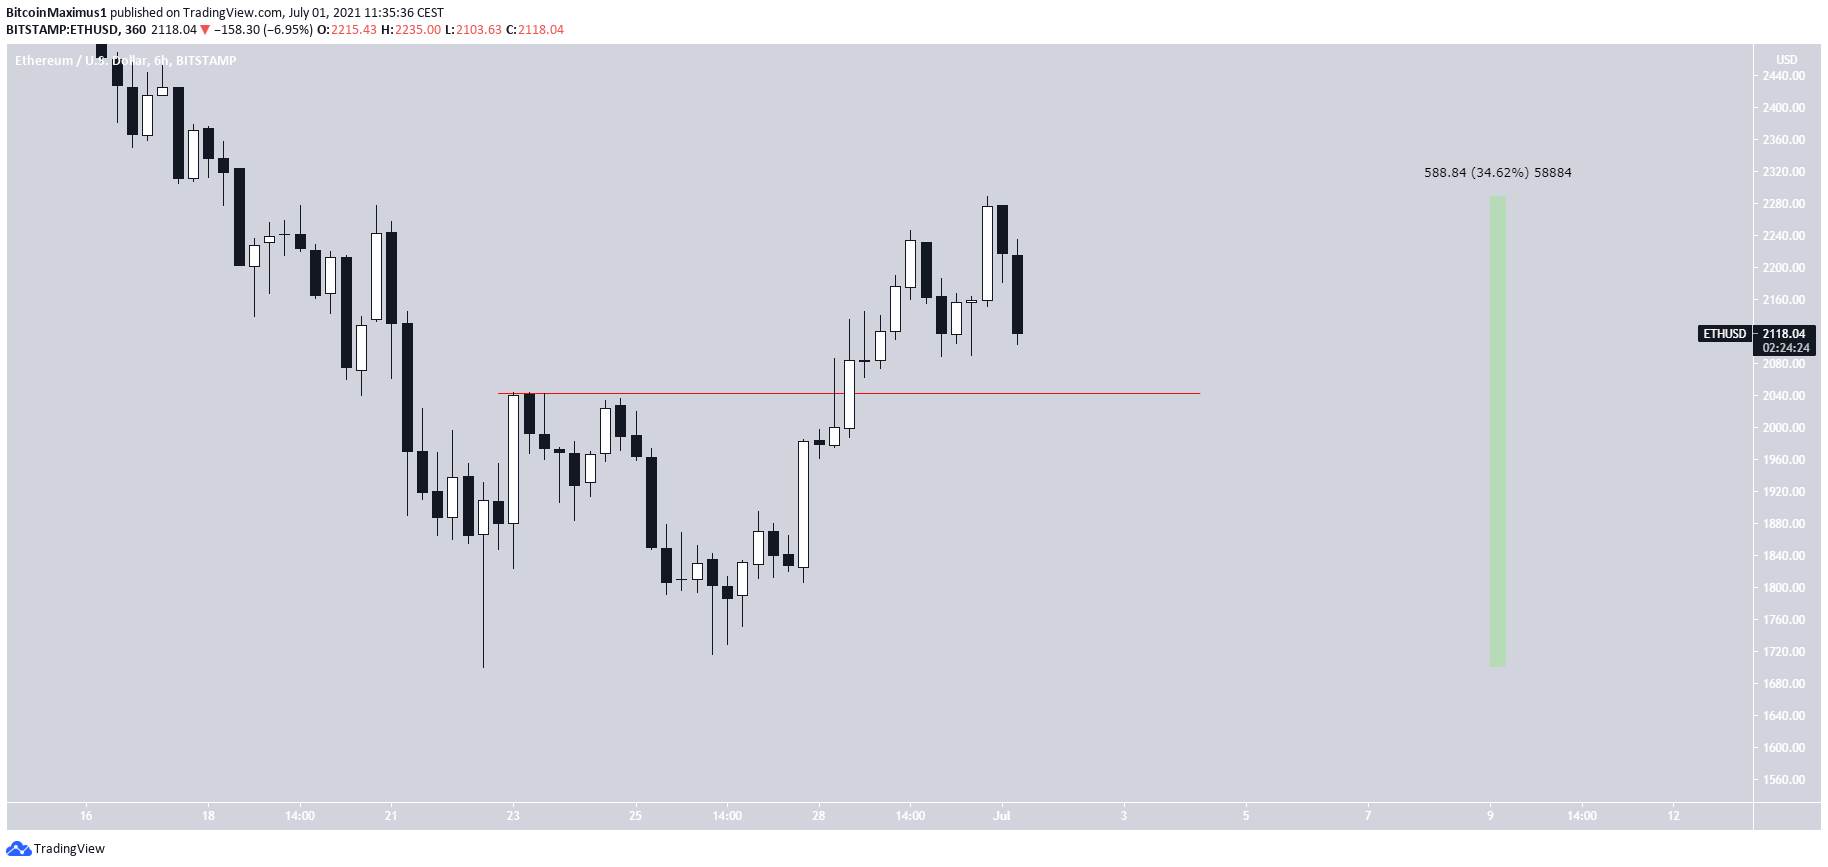
Measuring from the June 22 low, the current ETH high has been amounted to an increase of 34.62%. While the token has decreased since, there is no overlap (red line) with the previous high, allowing for the possibility that the upward movement is impulsive.
Bitcoin
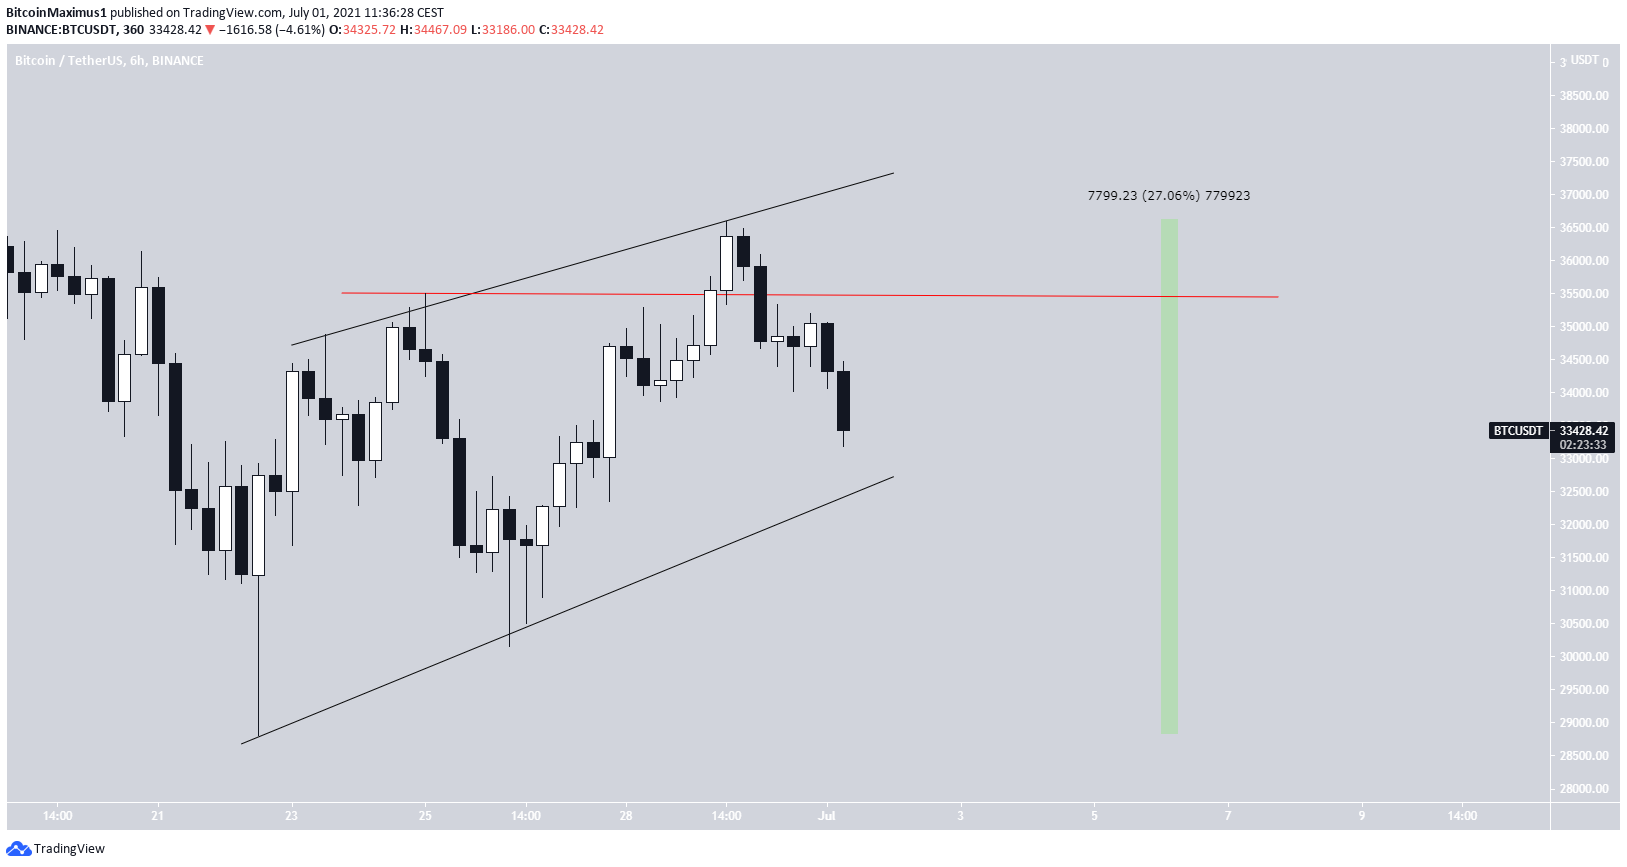
BTC has also been moving downwards since reaching an all-time high price on April 14.
Since May 19, it has been trading in a range between $40,500 and $31,400. On June 22, it reached a low of $28,805 before bouncing upwards with strength.
The upward move was preceded by very significant bullish divergence in the MACD, RSI & Stochastic oscillator. However, the RSI has yet to cross above 50 and the Stochastic oscillator has made a bearish cross.
Therefore, judging by the daily time-frame, the price action is more bullish for ETH, but technical readings are more bullish for BTC.
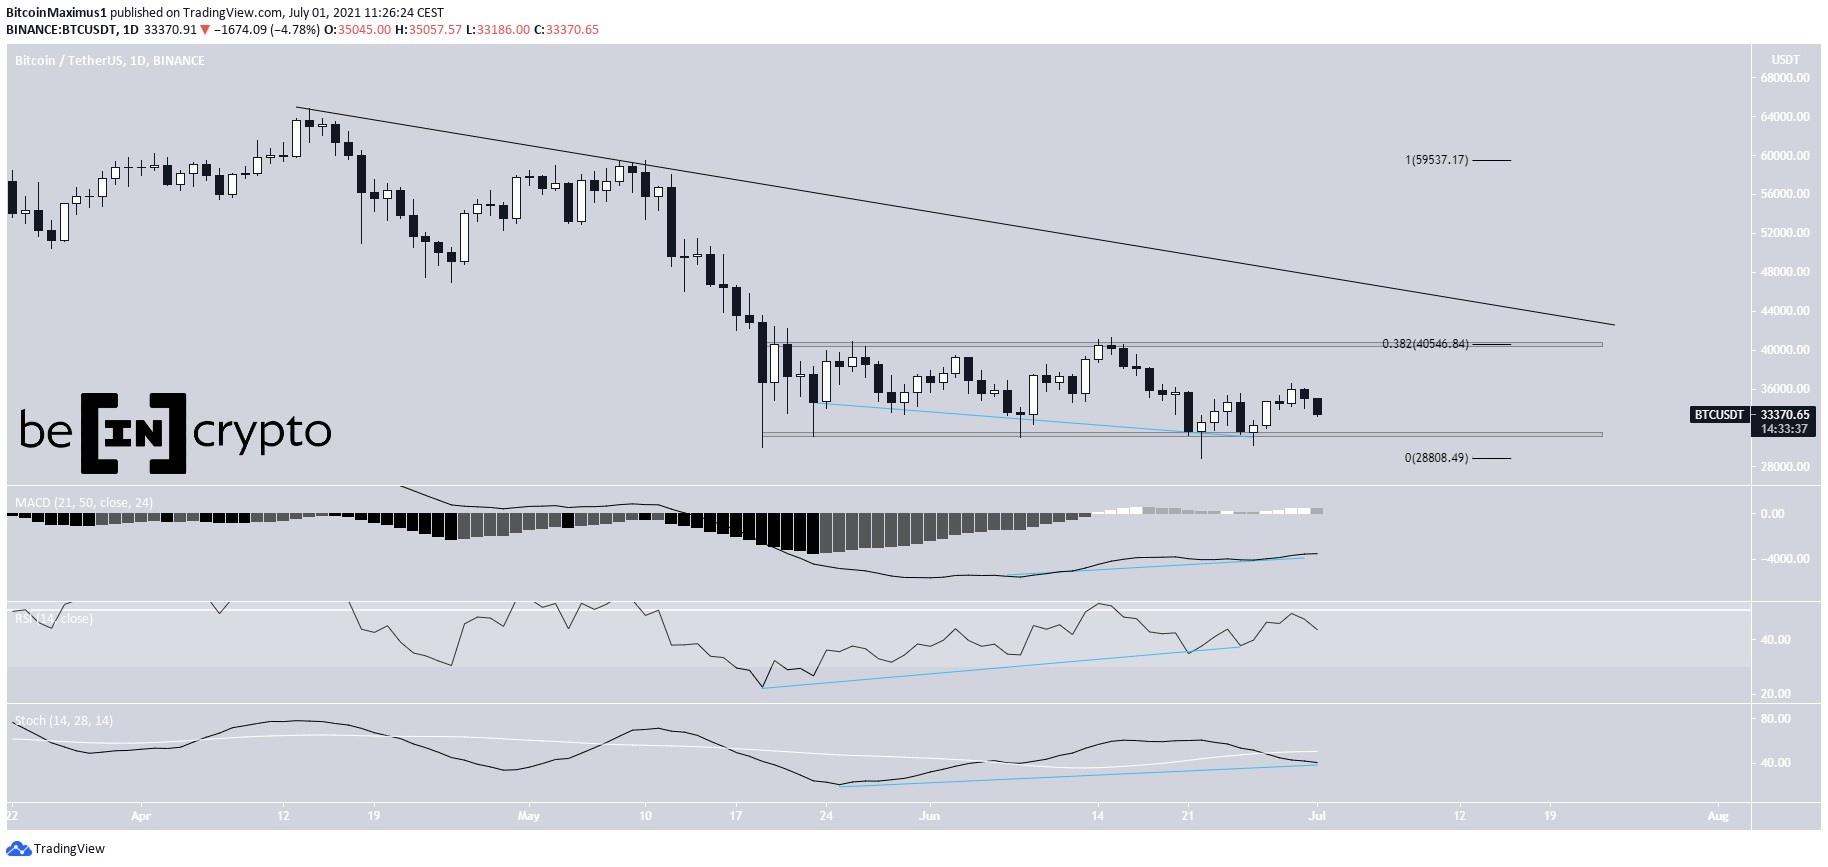
Measuring from the June 22 low, the current BTC high amounts to an increase of 27%. The token has decreased since and there is significant overlap with the previous high, indicating that the movement is corrective.
In addition, it is possible that the price is trading inside an ascending wedge, which is considered a bearish pattern.
In comparison to ETH, the short-term movement looks much more bearish for BTC.
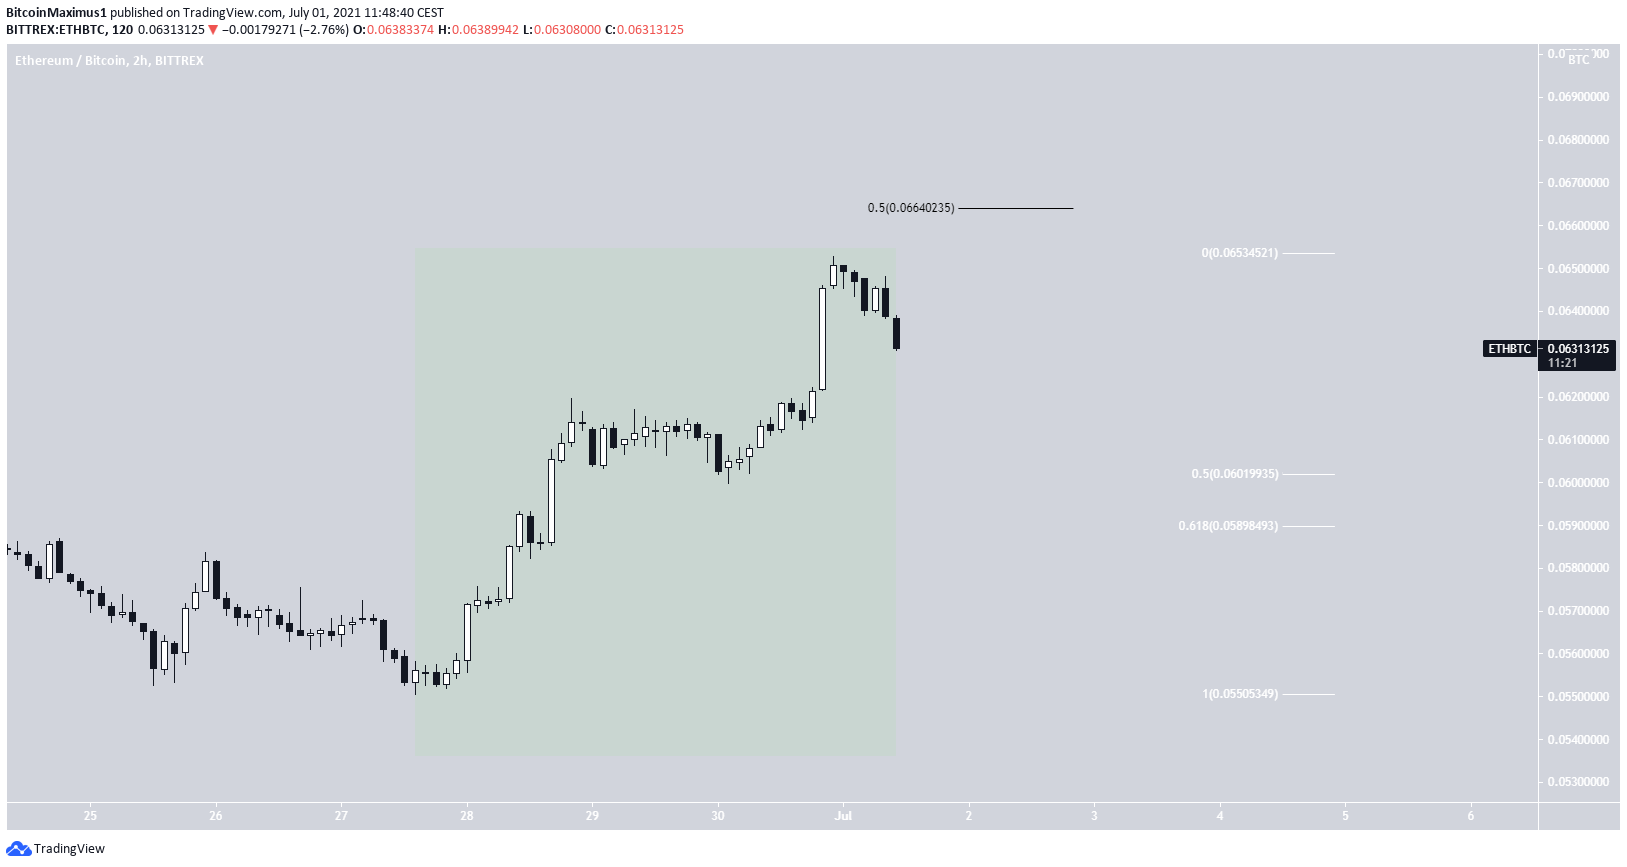
ETH/BTC
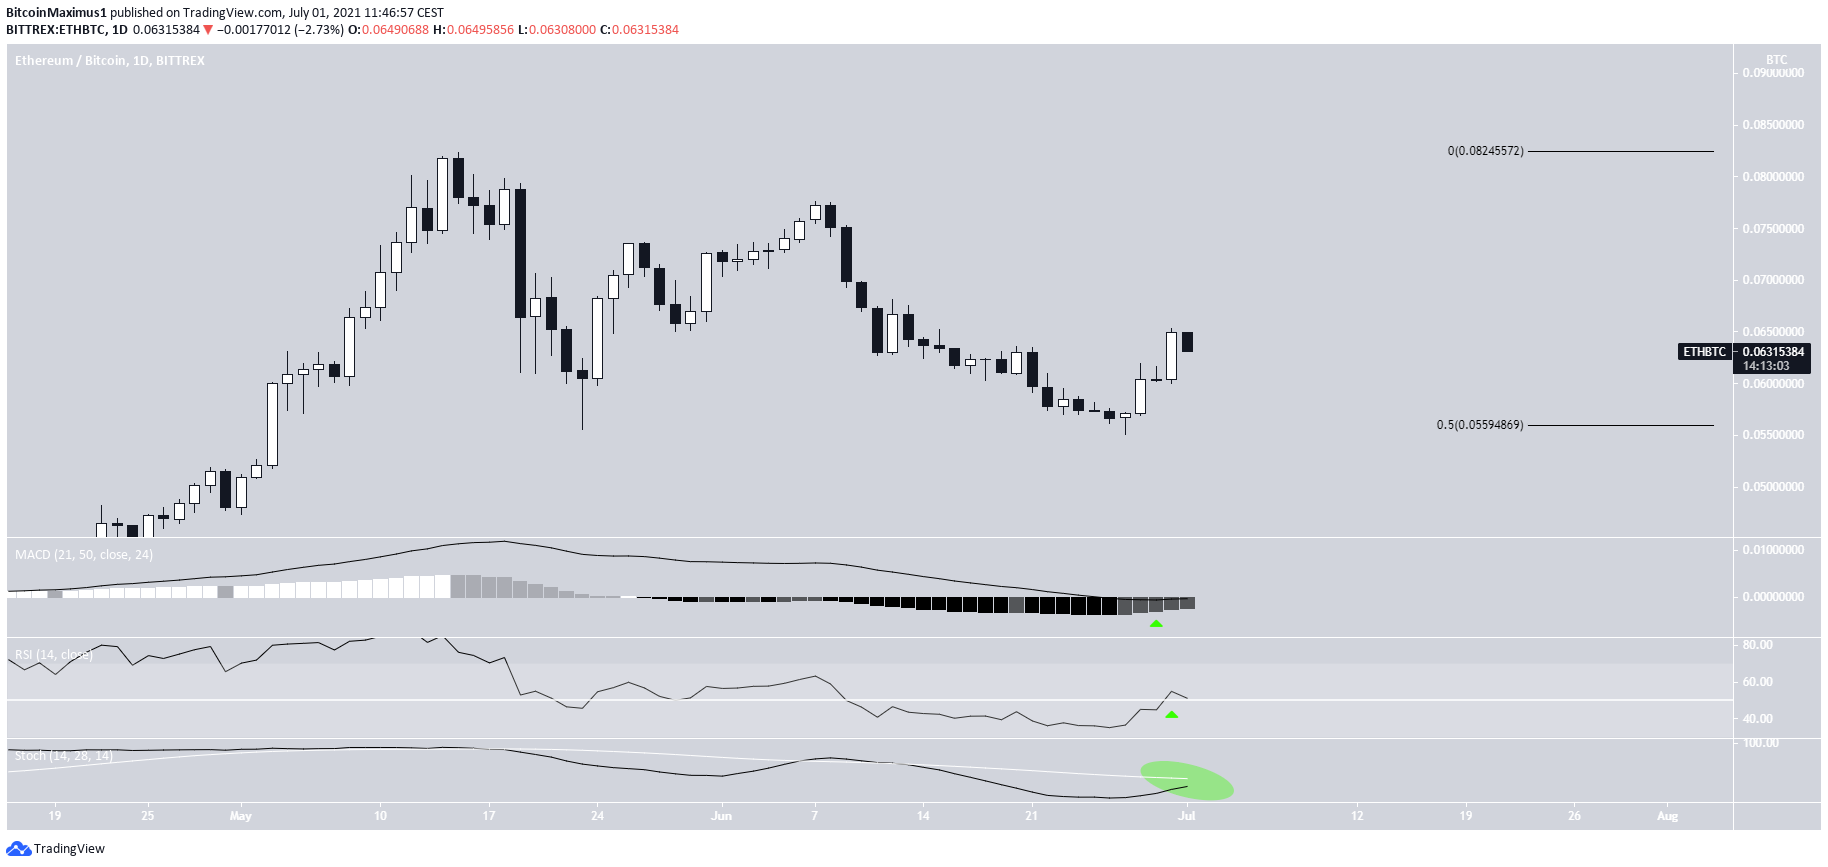
ETH/BC has been moving upwards since it reached a low of ₿0.055 on June 27. The low was made right at the 0.5 Fib retracement support level.
So far, the token has managed to reach a high of ₿0.065.
Technical indicators are bullish. The MACD has given a bullish reversal signal and has almost moved above the 0 line.
The RSI has already moved above 50 and the Stochastic oscillator is very close to making a bullish cross.
The shorter-term two-hour chart shows what looks like the beginning of a bullish impulse. After being rejected, ETH is trying to find support between the 0.5.-0.618 Fib retracement support levels at ₿0.058 – ₿0.06.
The creation of a higher low at this level would confirm the upward movement.