Waves.tech is a robust open-source blockchain project that facilitates the creation of innovative decentralized apps for daily use. It provides a user-friendly development infrastructure with easy-to-use app-building tools. Apart from that, developers can access development libraries, guides, education materials, and tutorials on waves.campus. WAVES is the prime governance token of this network and below is the technical analysis for the same.
Past Performance
On Jun 23, 2021, WAVES opened at $12.48. On Jun 29, 2021, WAVES closed at $15.37. Thus, in the past week, the price has increased by roughly 23%. In the last 24 hours, WAVES has traded between $14.21 – $15.88.
https://s3.tradingview.com/snapshots/h/HaMrUayf.png
Day-Ahead and Tomorrow
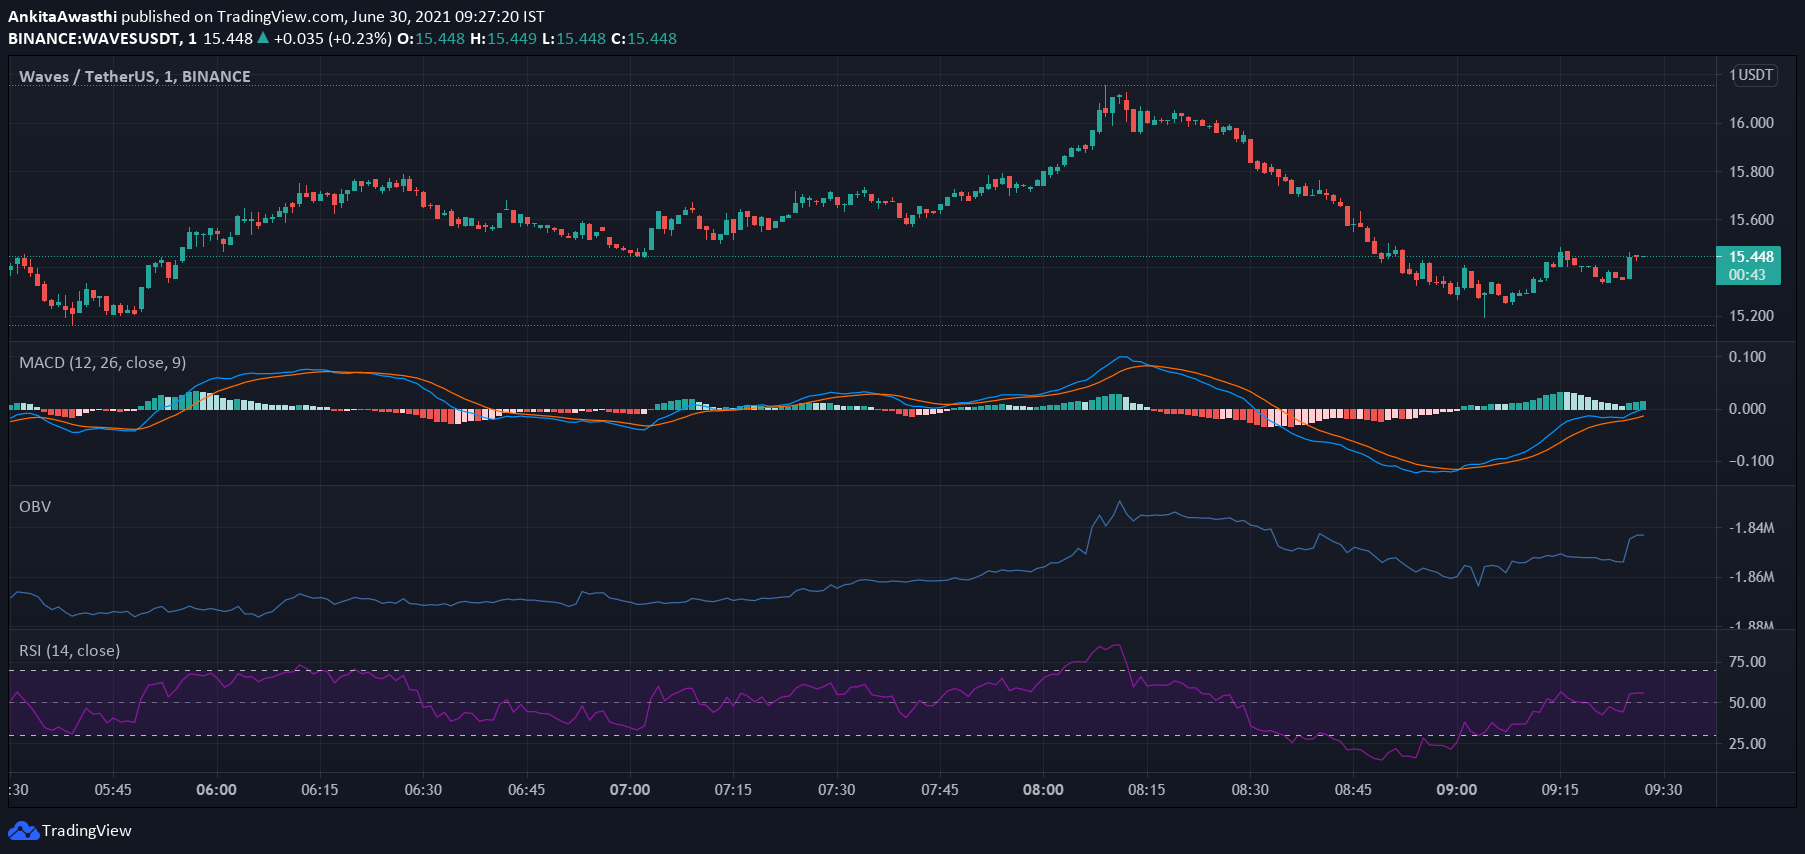
Currently, WAVES is trading at $15.45. The price has increased from the day’s opening price of $15.37. Thus, the market seems bullish.
The MACD and signal lines are negative. Thus, the overall market momentum is bearish. However, a bullish crossover by the MACD line over the signal line has occurred. Moreover, both the lines are closer to the zero line and may change signs soon. Hence, we can expect the price to start rising.
Currently, the RSI indicator is at 40%. It faced rejection at 56% and fell to the current level. Hence, selling pressures are high. High selling activity will push the WAVES price downwards.
Besides, the OBV indicator has started rising steadily. Thus, buying volumes are slowly overtaking selling volumes. High buying activity will exert upward pressure on the WAVES price.
In short, the RSI oscillator has given negative signals while the MACD and OBV indicators have given positive signals. Hence, the overall market momentum seems bullish. But, we have to wait and watch if an intermittent price pullback is a market correction or the beginning of a bearish trend.
WAVES Technical Analysis
Currently, the price is below the first Fibonacci pivot resistance level of $15.79. The price may soon fall below the Fibonacci pivot point of $15.15. Thereafter, we can expect the price to start rising again.
The price may soon test and fall below the 50% FIB retracement levels of $15.04. By day end, if the price retests and surpasses the 76.4% FIB retracement level of $15.48, then the price uptrend is strong enough to sustain till tomorrow.