XRP/USD – XRP Attempting Break Of June Downtrend
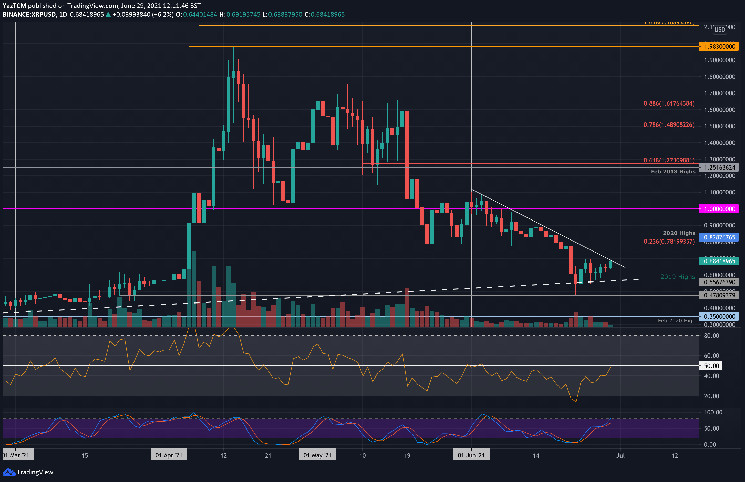
Key Support Levels: $0.6, $0.556, $0.5.
Key Resistance Levels: $0.7, $0.781, $0.8282.
XRP found support at the 2019 highs of $0.556 last week. Since then, XRP has rebounded and established support at $0.6.
The cryptocurrency has been trading beneath a descending trend line since the start of June. The recent rebound to $0.68 has allowed the coin to re-test this descending trend line. A break above should let XRP head back toward the 2020 highs at $0.8282 and possibly back above $1.00.
XRP-USD Short Term Price Prediction
Looking ahead, if the bulls push above the trend line and pass $0.7, the first resistance lies at $0.781 (bearish .236 Fib). This is followed by $0.8282, $1.00, and $1.25 (Feb 2018 highs & bearish .618 Fib).
On the other side, the first support lies at $0.6. This is followed by $0.55 (2019 highs), $0.5, $0.478, and $0.35.
The daily RSI is now at the midline, indicating that the bears have left the market and there is currently indecision. A break above the midline would mean that the momentum has shifted to bullish for the first time since the mid-May market collapse.
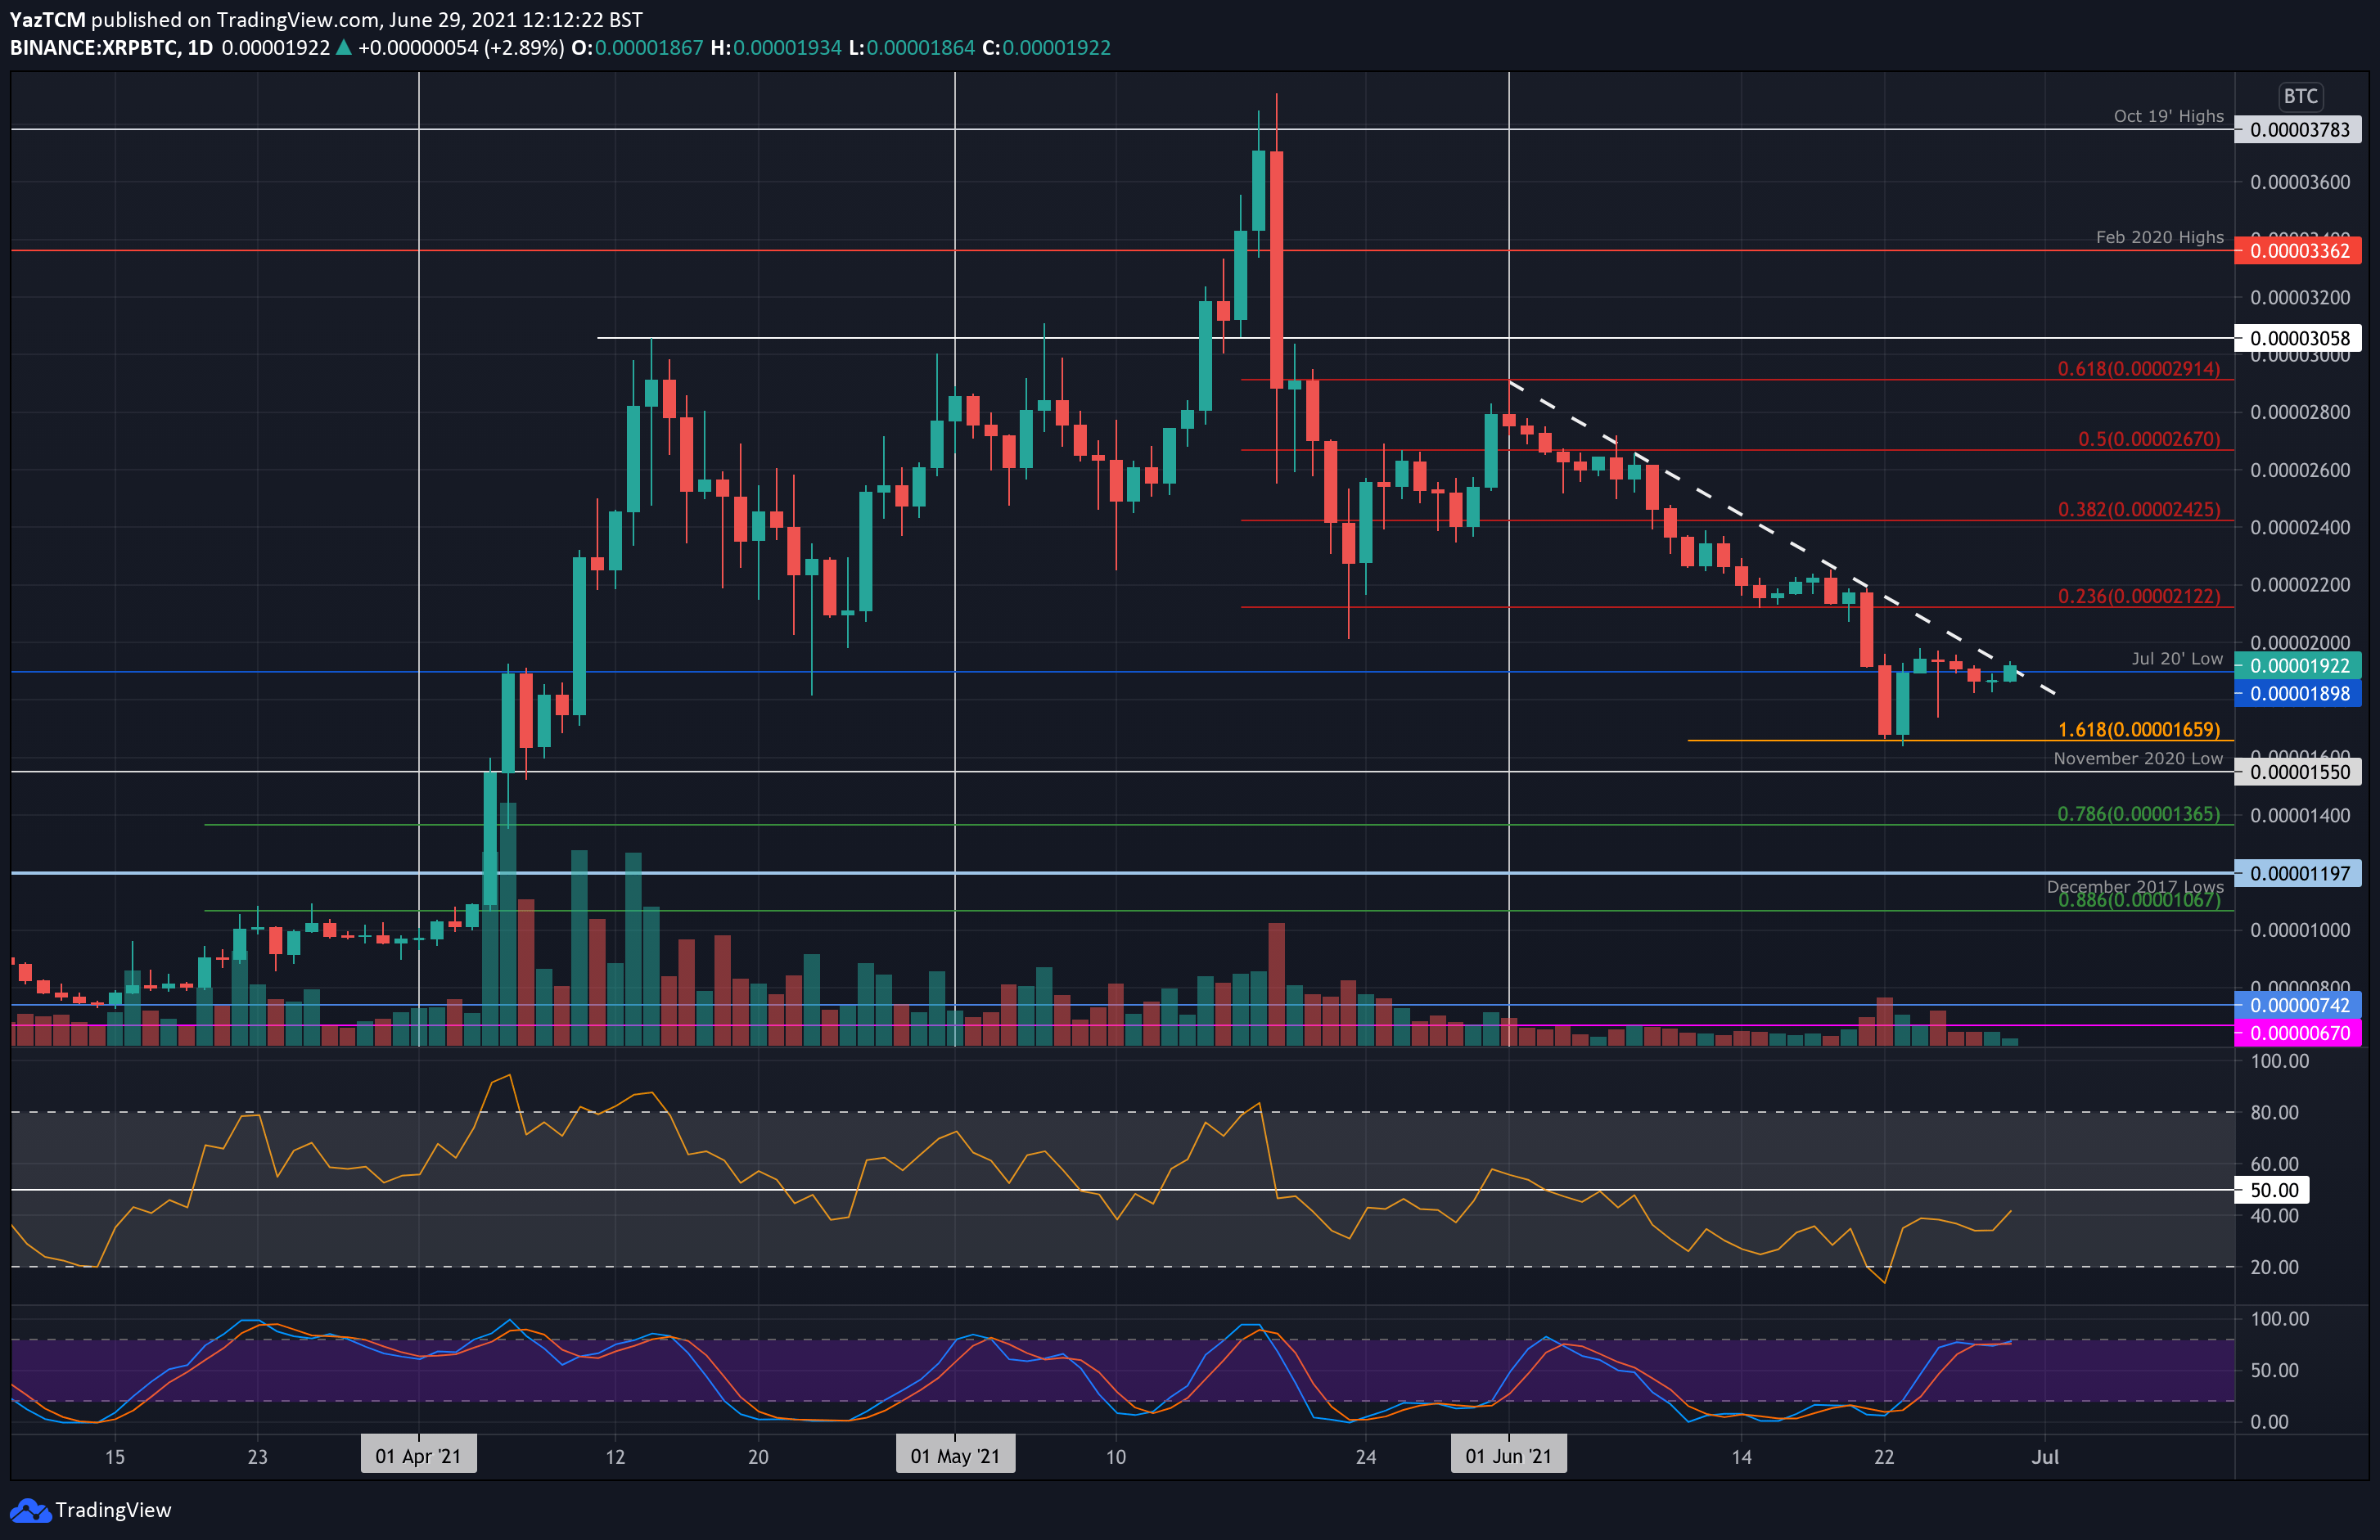
XRP/BTC – Bulls Attempt Push Toward 2000 SAT.
Key Support Levels: 1900 SAT, 1800 SAT, 1660 SAT.
Key Resistance Levels: 2000 SAT, 2122 SAT, 2425 SAT.
Against BTC, XRP has also been trading beneath a descending trend line in June. The coin fell to 1660 SAT (downside 1.618 Fib) last week and created a new low, not seen since early April.
XRP has since bounced from there and is now attempting to breakout above the descending trend line and end the June downtrend.
XRP-BTC Short Term Price Prediction
Looking ahead, the first resistance above the trendline lies at 2000 SAT. This is followed by 2122 SAT (bearish .236 Fib), 2425 SAT (bearish .382 Fib), and 2670 SAT (bearish .5 Fib).
On the other side, the first support lies at 1900 SAT (July 20 low). This is followed by 1800 SAT, 1660 SAT (downside 1.618 Fib Extension), 1550 SAT (Nov 2020 low), and 1365 SAT (.786 Fib).
The RSI is still in bearish territory here as it sits beneath 50. However, it is rising, which indicates decreasing bearish momentum within the market.