- Stellar lumen price extended its decline and it even tested $0.2000 against the US Dollar.
- XLM price is now trading near $0.2600 and the 55 simple moving average (4-hours).
- There is a key bearish trend line forming with resistance near $0.2600 on the 4-hours chart (data feed via Kraken).
- The pair is likely to start a major increase if it surpasses $0.2600 and $0.2700.
Stellar lumen price is facing hurdles near $0.2600 and $0.2700 against the US Dollar, similar to bitcoin. XLM price could gain bullish momentum if it breaks $0.2700.
Stellar Lumen Price Analysis (XLM to USD)
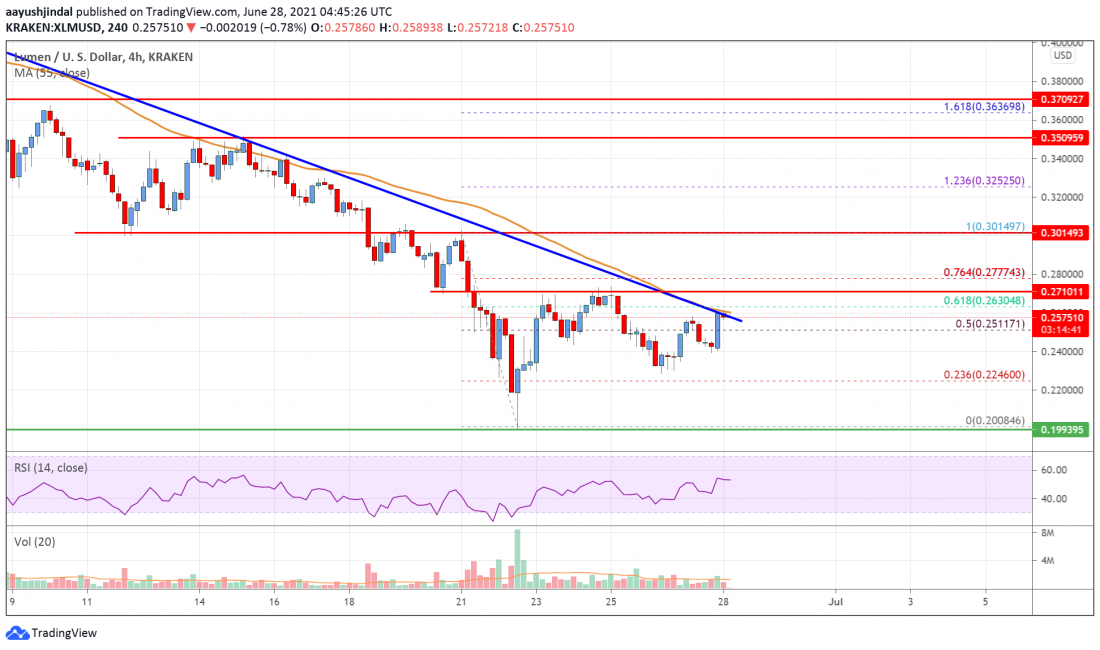
In the past few days, stellar lumen price extended its decline below $0.3000 against the US Dollar. The XLM/USD pair even broke the $0.2500 support zone before the bulls appeared near the $0.2000 zone.
The price started a steady recovery wave above the $0.2200 and $0.2300 levels. The bulls pushed the price above the $0.2400 resistance. It even climbed above the 50% Fibonacci retracement level of the recent decline from the $0.3014 high to $0.2008 low.
It is now trading near $0.2600 and the 55 simple moving average (4-hours). There is also a key bearish trend line forming with resistance near $0.2600 on the 4-hours chart.
The trend line is close to the 61.8% Fibonacci retracement level of the recent decline from the $0.3014 high to $0.2008 low. The next major resistance is near the $0.2700 level. If there is a successful break above the trend line and $0.2700, the price could gain bullish momentum.
The next key resistance could be $0.3200, followed by the $0.3500 zone. An initial support on the downside is near the $0.2400 zone. Any more losses might call for a drop towards the $0.2240 support zone. A downside break below the $0.2240 support might call for a retest of $0.2000.
Stellar Lumen (XLM) Price
The chart indicates that XLM price is clearly trading near $0.2600 and the 55 simple moving average (4-hours). Overall, the price is likely to start a major increase if it surpasses $0.2600 and $0.2700 in the near term.
Technical Indicators
4 hours MACD – The MACD for XLM/USD is slowly gaining momentum in the bearish zone.
4 hours RSI – The RSI for XLM/USD is currently above the 50 level.
Key Support Levels – $0.2450 and $0.2200.
Key Resistance Levels – $0.2600, $0.2700 and $0.3000.