|
|
Thorchain is a completely autonomous and decentralized liquidity protocol. It facilitates users to make crypto deposits and provides liquidity through yield farming. Users can also execute swap transactions on the Thorchain platform using web and desktop interfaces. In other words, users can exchange digital assets without losing custodial rights over their assets. RUNE is the customized token of this ecosystem. Let us look at the technical analysis for the same.
Past Performance
On Jun 18, 2021, RUNE opened at $8.74. On Jun 24, 2021, RUNE closed at $6.37. Thus, in the past week, the RUNE price has decreased by roughly 27%. In the last 24 hours, RUNE has traded between $5.35 – $6.82.
https://s3.tradingview.com/snapshots/m/mjYjUD8W.png
Day-Ahead and Tomorrow
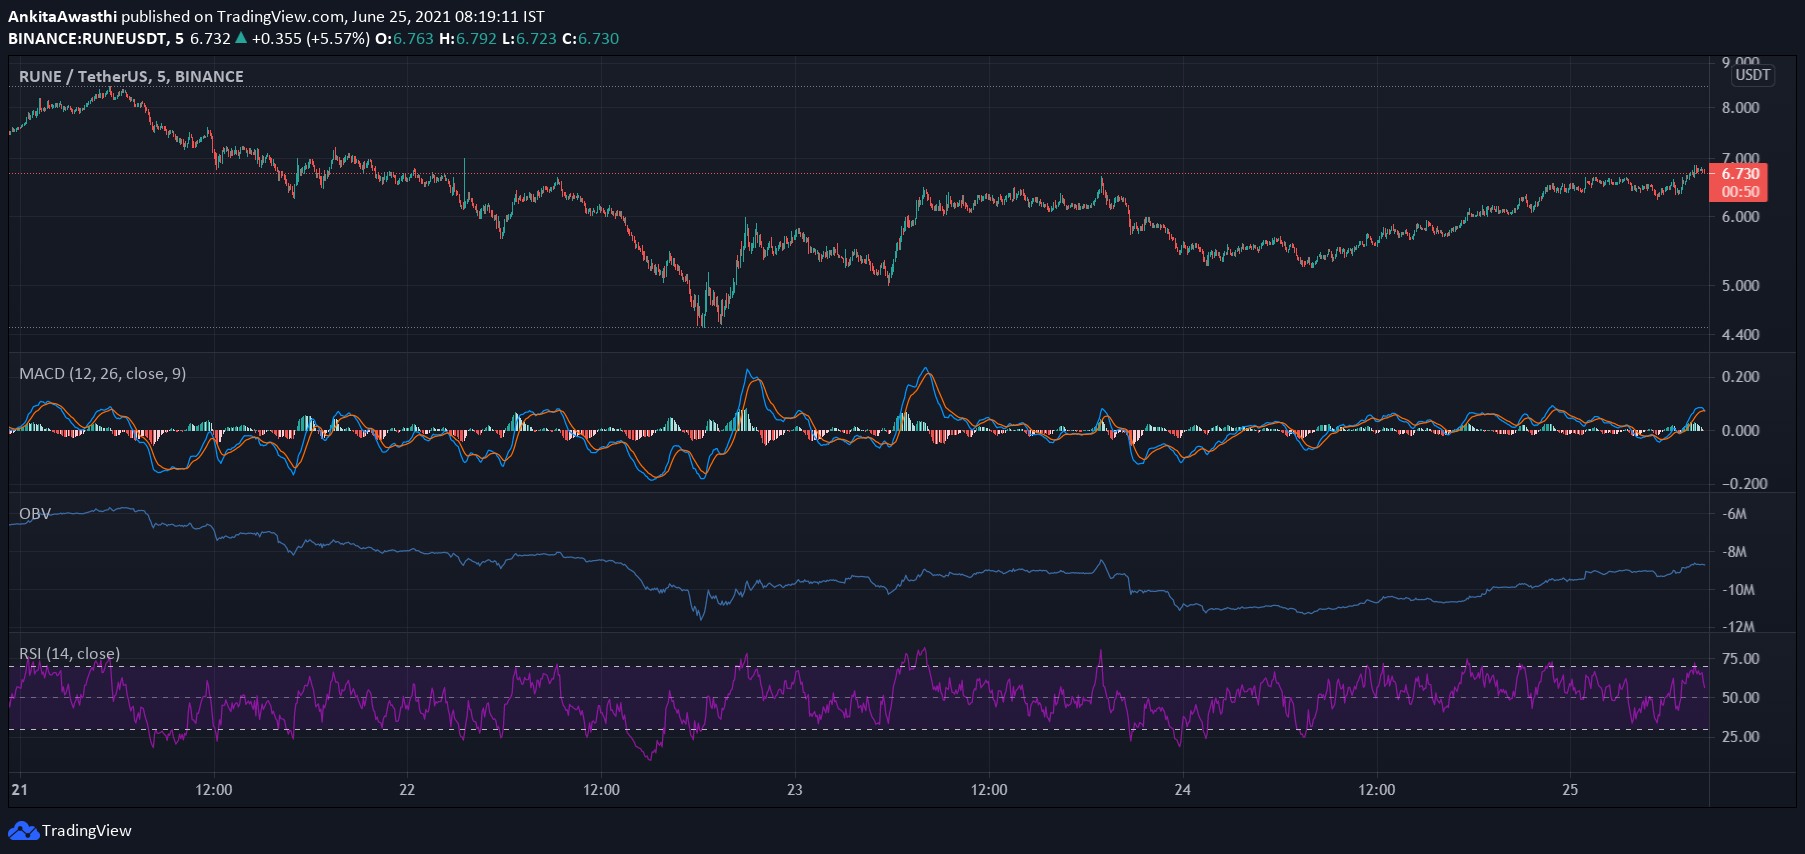
Currently, RUNE is trading at $6.73. The price has increased slightly from the day’s opening price of $6.37. Thus, the market seems bullish.
The MACD and signal lines are positive. Moreover, a bullish crossover by the MACD line over the signal line has occurred. Thus, the overall market momentum is bullish. Hence, we can expect the price to go up further.
Currently, the RSI indicator is at 53%. It faced rejection at 70% and fell to the current level. Hence, selling pressures are high. High selling activity will exert downward pressure on the RUNE price.
The OBV indicator has started rising steadily. Thus, buying volumes are higher than selling volumes. Heavy buying activity will push the price further up.
In short, the OBV and MACD oscillators have given bullish signals, while the RSI oscillator has given bearish signals. Thus, we can say that currently, the overall market momentum is positive. But, we have to wait and watch, if the intermittent price pullbacks are price corrections or indicative of a bullish trend reversal.
RUNE Technical Analysis
Currently, the price is above the first Fibonacci pivot resistance level of $6.74. It may soon surpass the subsequent resistance levels of $7.09 and $7.65, respectively. Thereafter, we have to wait and watch if the price starts falling or continues to rise.
The price has tested and broken out of the 23.6% FIB retracement level of $6.47. It may soon breach the 23.6% FIB extension level of $7.17. If by day close, the price retests and falls below these levels, then probably a price downtrend has set in. In that case, the price may continue to fall tomorrow as well.