Revain is an online platform for Ethereum blockchain-based token reviews, designed to allow developers to receive constructive feedback about their projects. The protocol also incentivizes authors to provide high-quality reviews. Revain was the first platform to combine the features of traditional review sites and blockchain technology. Revain’s ultimate goal is to create a legitimate and genuine feedback structure for all global products and services that utilize emerging technologies, such as machine learning and blockchain. Let us look at the REV technical analysis.
Past Performance
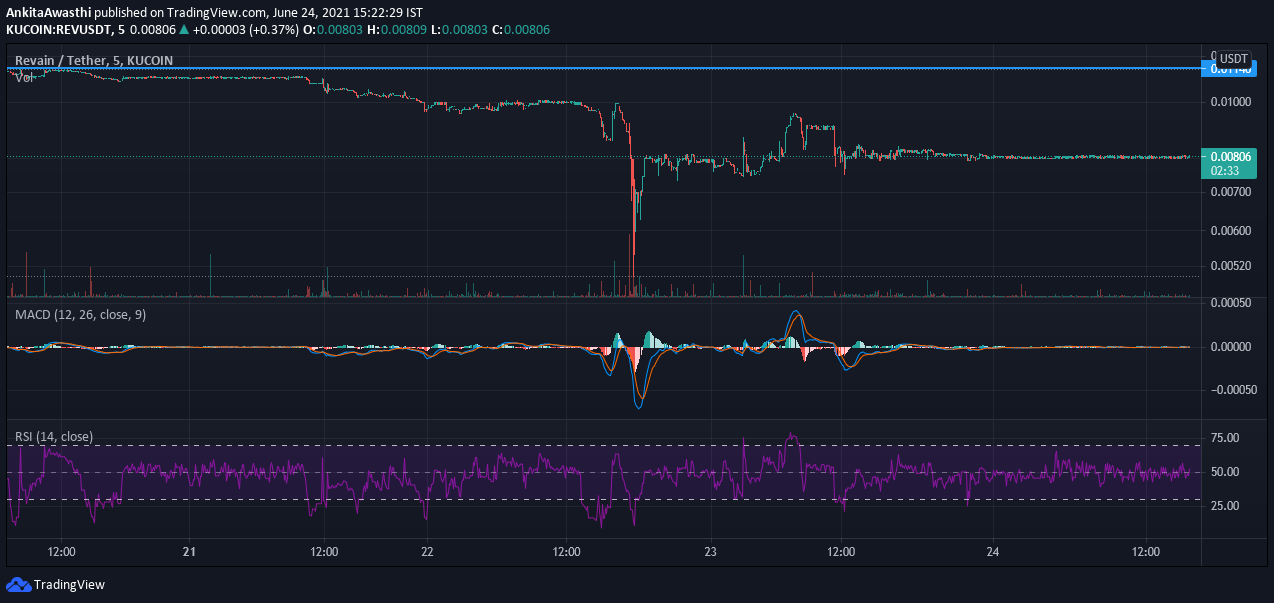
On Jun 23, 2021, REV opened at $0.00802. It moved and fell drastically to $0.00502. This was a 36% move within the same day. It recovered the same day to slowly reach $0.00805 and has steadily been trading around this range only. REV saw an increase to $.00914 for a few hours, and that dropped o $0.0083 levels. It has shown dramatic swings since the last two days.
https://www.tradingview.com/x/cwWP6pLx/
Day-Ahead and Tomorrow
Currently, REV is trading at $0.00805. The price has been in a range, trading between $0.00805 and $0.00809. Thus, the market can go either way.
The MACD line is very flat, hovering near zero. This shows the market right now is waiting for more volumes to pick up.
Currently, the RSI indicator is at 50%. It faced rejection at 62% and fell to the current level. However, the low trading volumes seem to indicate the market can go either way, and we can see activity in a few hours’ time for REV.
However, the OBV indicator is upward sloping. Thus, buying volumes are higher than selling volumes. Thus, a balancing view is forming which will slow down the fall.
In short, the RSI and MACD oscillators have given bearish signals, while the OBV oscillator has given flat signals. Thus, we can say that currently, the overall market momentum is negative. But, we have to wait and watch, if the intermittent price rises are price corrections or indicative of a bearish trend reversal.
REV Technical Analysis
Currently, the price needs to break the first Fibonacci pivot resistance level of $0.0114. It may soon move over around it and look further to touch the Fibonacci pivot point of $0.0148. Thereafter, we have to wait and watch if the price starts rising or continues to fall.
The price has tested and broken out of the 23.6% FIB retracement level of $0.0503. However, it may soon retest this level and fall below it. We anticipate the MACD signals to work out and give a push towards the positive direction where it can next cross the pivot levels of $0.0816.