1INCH and Tellor prices are recovering, though with relatively low participation. Even so, TRB/USDT prices are open for 90. On the other hand, 1INCH/USDT uptrend is valid if $2.2 holds.
Tellor (TRB)
The oracle provider links Ethereum smart contracts with real-world, tamper-proof data.
Past Performance of TRB
May was brutal for DeFi tokens. Still, TRB prices were firmer on the tail-end, mostly consolidating, maintaining bulls’ confidence.
TRB is up 11 percent on the last trading day on increasing upward momentum. During the same period, participation is stable at $91 million.
Day-Ahead and What to Expect
TRB/USDT technical analysis suggests demand in lower time frames.
Nonetheless, candlestick arrangements support bears.
For instance, TRB/USDT prices are ranging with comparatively low trading volumes.
Additionally, prices are inside May 19 bear bar and are below the middle BB—a flexible resistance line.
TRB/USDT Technical Analysis
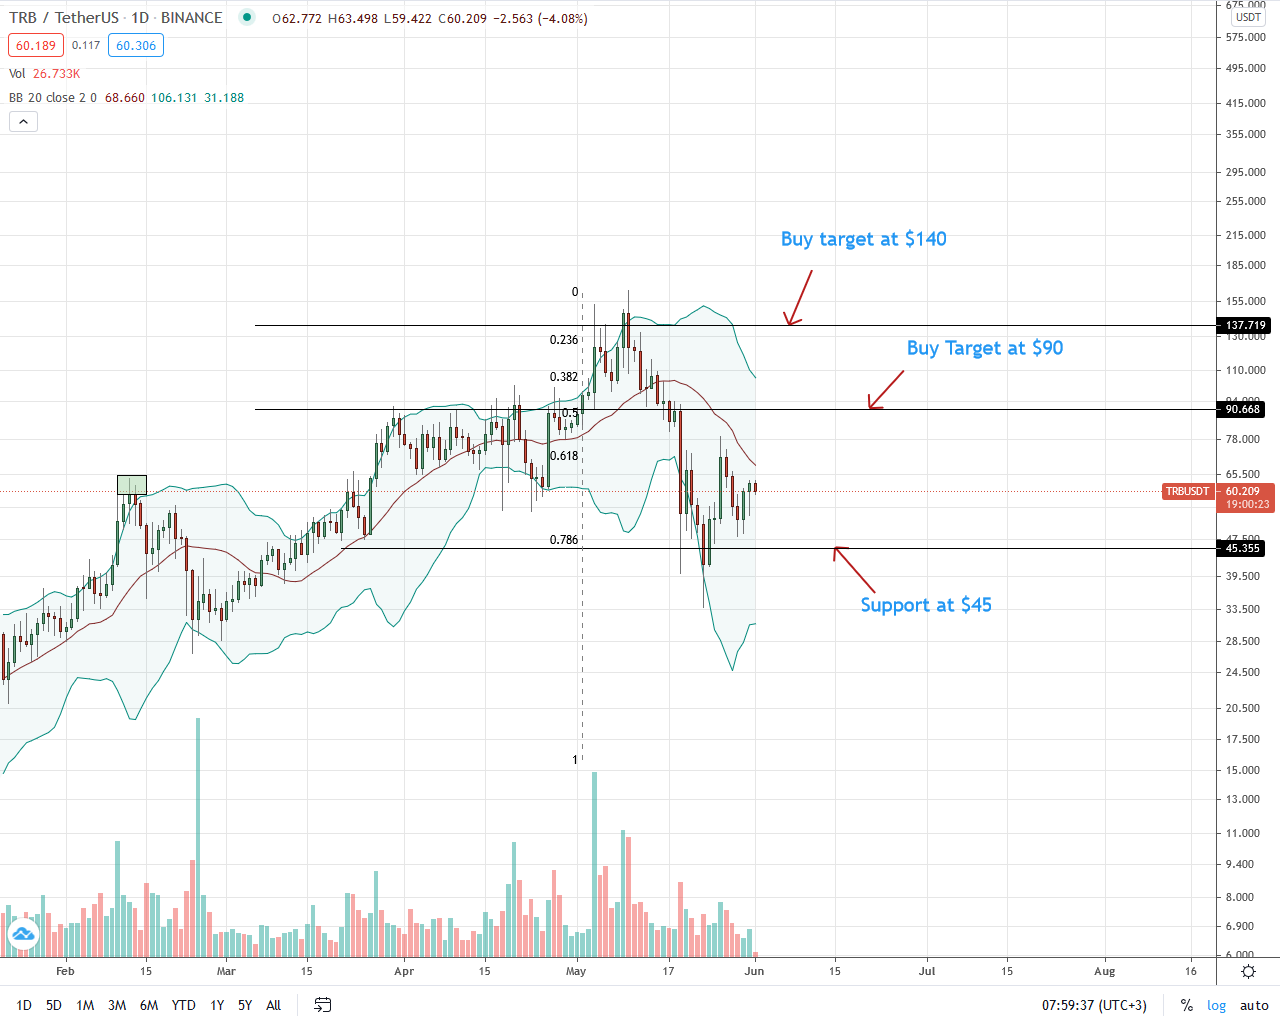
TRB prices are in range inside the May 19 bear bar, below the middle BB, and within a $45 zone from the daily chart.
For aggressive bulls, every low may be a loading opportunity with targets at $90.
However, if sellers flow back, forcing prices below $45, TRB/USDT may slide to March 2021 lows of around $30.
1Inch
The Ethereum, xDAi, and Binance Smart Chain (BSC) dApp is a DEX aggregator. Using the 1INCH governance token, the platform offers the cheapest swapping route for traders.
Past Performance of 1INCH
Reflecting the state of DeFi token price action, 1INCH is in range within a tight zone.
1INCH found support at the 78.6 percent Fibonacci retracement level.
Unlike the dip from mid-May 2021, bulls aren’t rapid since the reversal attempt is with comparatively lighter trading volumes.
As of writing, 1INCH prices are up 12 percent in the past 24 hours versus the USD.
Day-Ahead and What to Expect
INCH technical analysis hints at low-level support, though bears are in control.
The immediate resistance line is $3.5—the 61.8 percent Fibonacci retracement line of the last five months.
Meanwhile, support lies at $2.2, a critical reaction level.
1INCH Technical Analysis
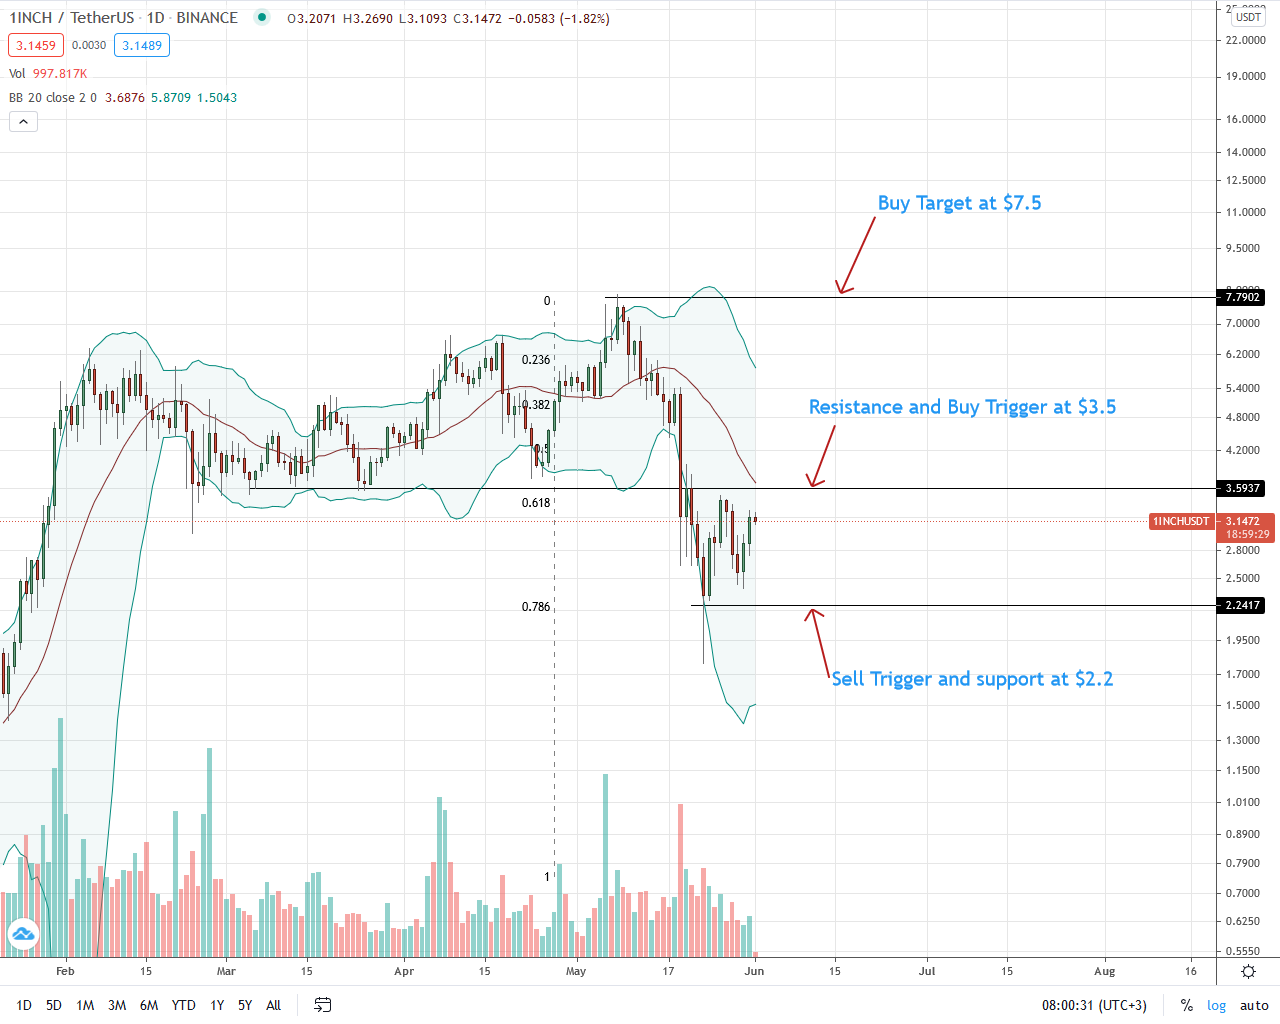
Sellers are in control as aforementioned.
A reversal of May 19 losses could be catalyzed by rapid expansions above $3.5 with comparatively high trading volumes. Then, the first target for 1INCH/USDT bulls would be May 2021 highs of $7.5.
An unexpected dump below $2.2 could trigger another sell-off towards $1 and $0.75—January 2021 lows.