The Polkadot (DOT) ecosystem is rising in popularity, earning the status of ‘Ethereum killer’ over the ability to handle shortcomings on the ethereum blockchain like scalability and high gas fees.
The network’s utility token DOT has also emerged as one of the most successful digital assets over the past year, gaining prominence amid the DeFi boom.
The price of DOT is now staging a recovery from the monthly low of $13.64 recorded on May 23 amid wide-scale market volatility. Previously, DOT also recorded another drop in value on May 19 alongside most altcoins. The price correction halted DOT’s momentum towards $50.
However, Polkadot seems to have amassed buy signals suggesting a bullish phase is on the way. By press time, the token was trading at $22.14, surging 40.55% from the monthly low.
Why Polkadot is gaining prominence
Notably, DOT’s rise stems from the network’s use cases since Polkadot is a heterogeneous sharded blockchain that makes it fast and scalable. It offers solutions to problems encountered by most blockchains.
Polkadot also holds a unique set of functions that can be utilized in DeFi protocols. Notably, the DeFi ecosystem continues to record an inflow of capital.
The potential by Polkadot is also highlighted by the increasing market exposure for the blockchain. Recently, challenger bank Current opted for Polkadot as part of its DeFi offering debut. The integration offers DOT exposure to Current’s three million users.
Moreover, on May 18, Valour, a Swiss digital asset investment firm, launched exchange-traded products (ETPs), offering exposure to Polkadot.
DOT’s future price outlook
Currently, the market appears to be overextended on the downside based on the weekly stochastic that is in the oversold territory below 20. There is also a signal to weaken DOT’s downward momentum with the daily chart MACD histogram printing higher lows below the zero line.
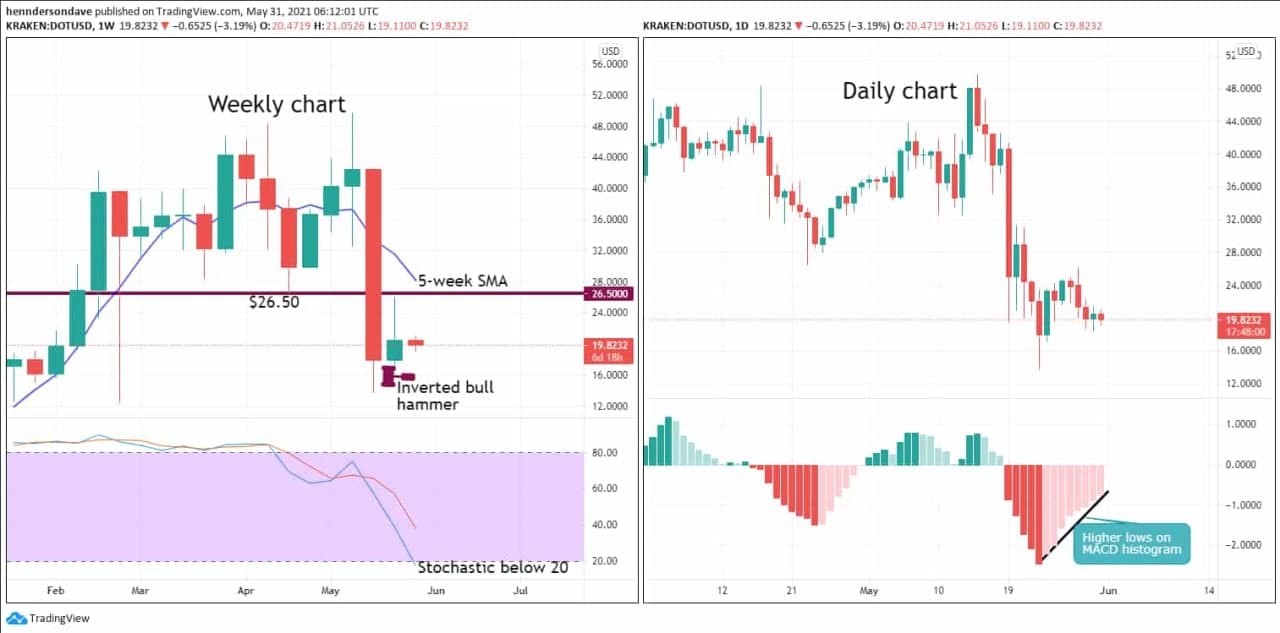
For Polkadot, the immediate resistance is represented by the April low of $26.50. It was followed y $28.14, represented by the downward trending 5-week simple moving average. Elsewhere, last week’s low of $17.10 provides the support, but if the level is breached, it will correct to May 23rd’s low of $13.81.
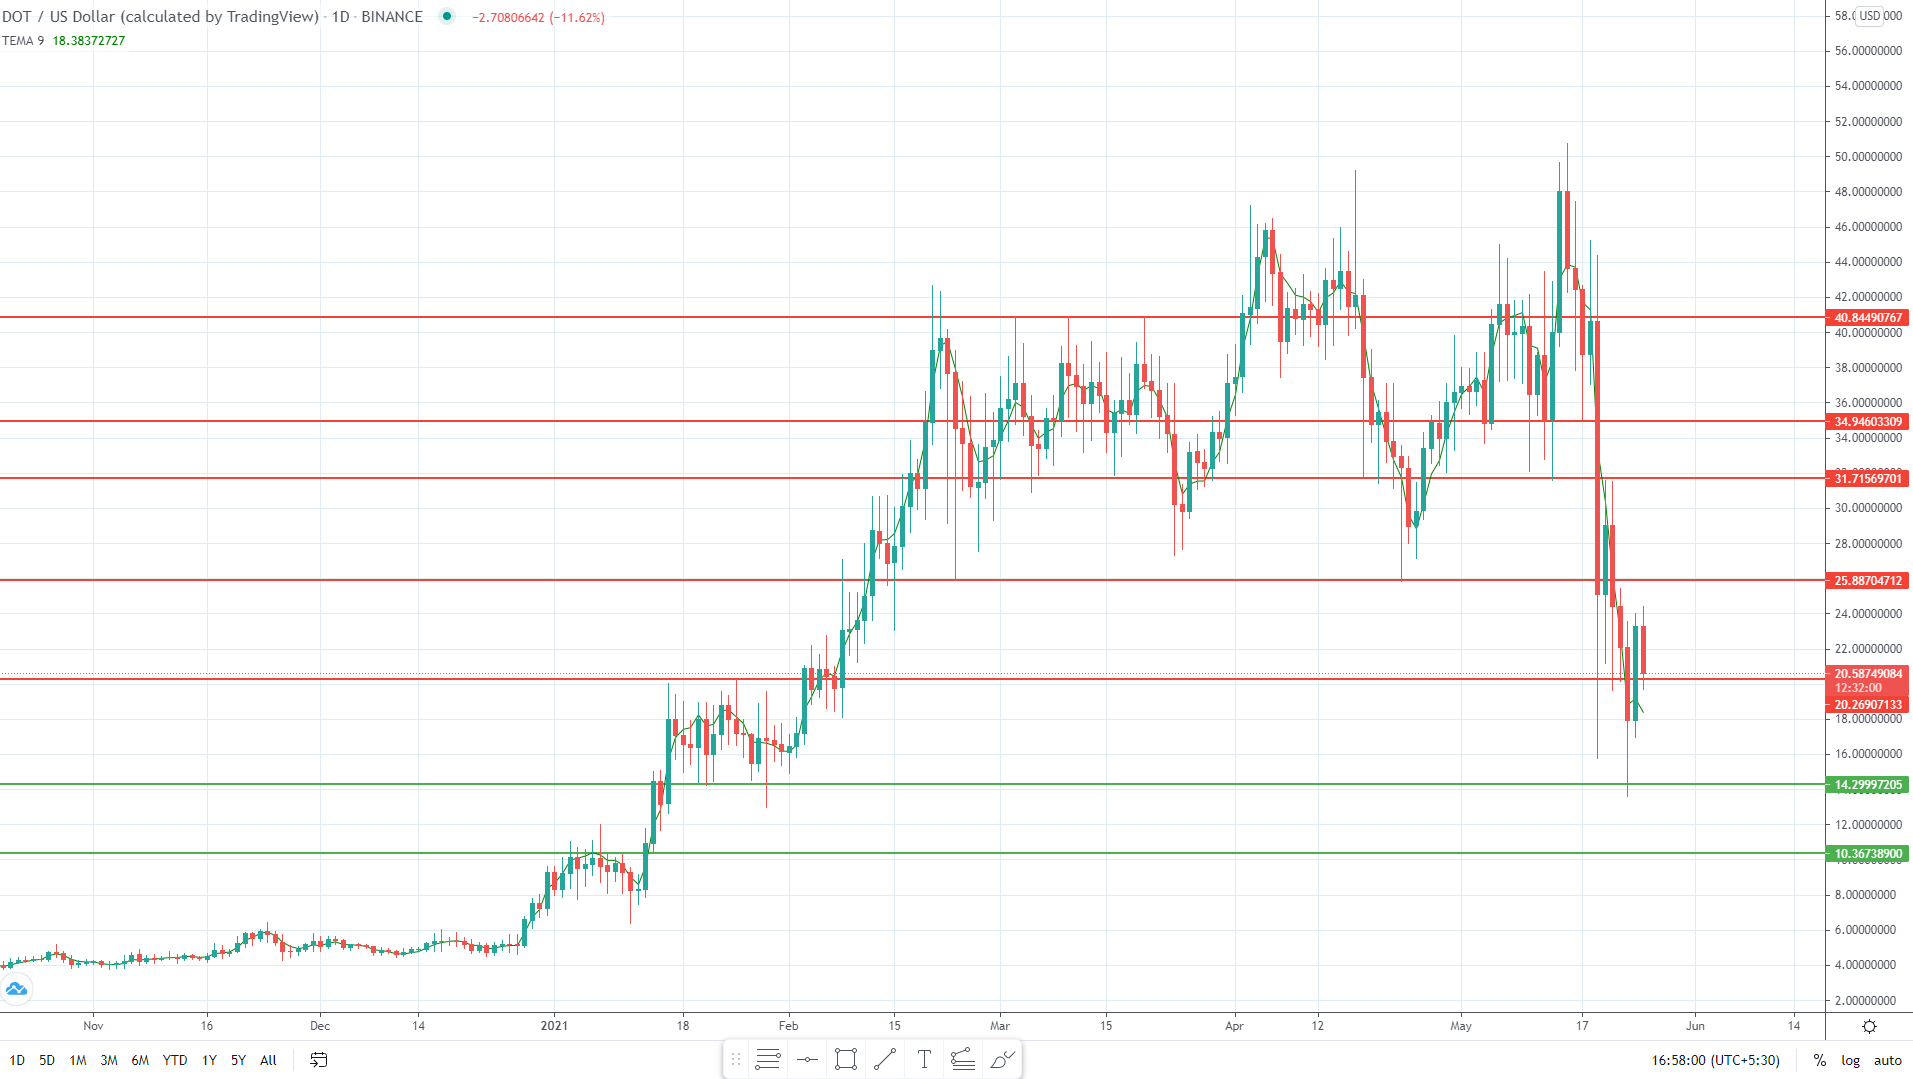
At the time of writing, DOT is facing the resistance level at $25, and if the position is breached, the token could test the $28 mark, surging by about 26% from the current value.
Furthermore, if DOT manages to rise above $30, it would possibly trigger a massive buy signal, indicating a bullish trend that will place $50 in sight. On the flip side, the support levels at $20 should be held firm to keep the price rally intact.