- IOTA Price continued to trade sluggishly after declining from a high of $1.12 to a low of $0.95 in Saturday’s intraday session
- The IOTA/BTC pair is trading at 0.00002851 with a loss of 2.32% at press time
- The current price of the IOTA coin is $0.98 established on the back of a 6.95% decrease in the last 24 hours
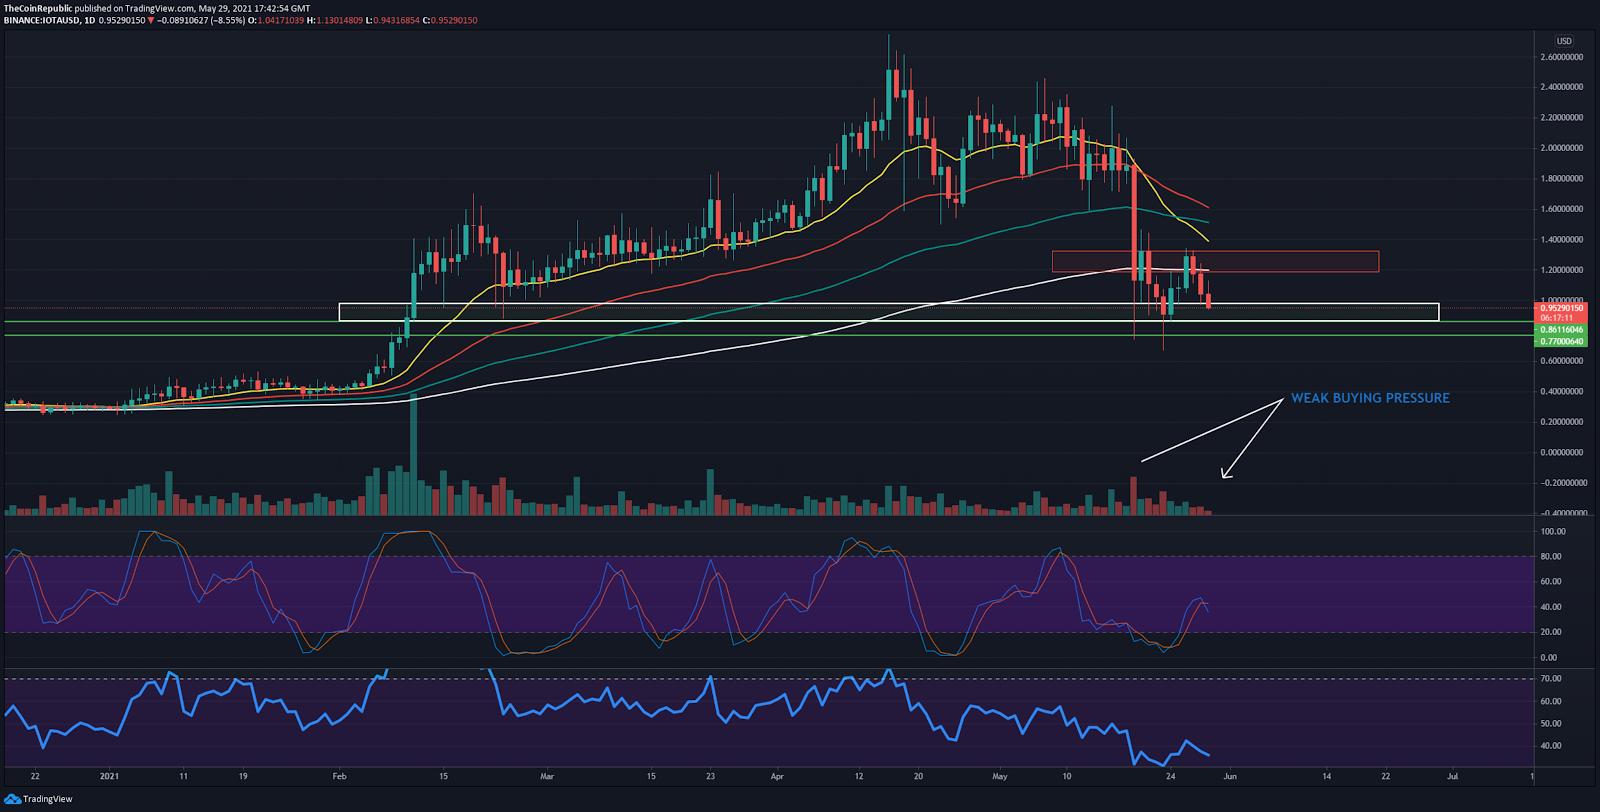
IOTA, like the majority of the altcoins, has been a victim of weak buying pressure. The pressure was built up by the obv’s trajectory since the crypto sell-off.
IOTA price chart on the daily frame has failed to demonstrate any tradable chart pattern as a consequence of a rise in bitcoin dominance. Today’s intraday session triggered IOTA to abandon the $1 level. Further downward exertion could provoke a 10% decline from the current price.
IOTA bulls need to buckle up and steer clear of the 200 EMA which is currently serving as a critical resistance to the token. The non-performance of the bulls to do so will empower the critical EMAs to transpire a death cross.
On the upside, there exists a resistance channel between $1.16 to $1.32. A breach of these levels will guarantee a prevalence of the bulls for IOTA.
However, the price action is extremely incapacitated as evidenced by three black crows on the daily chart. At this point, a reversal seems highly unlikely due to the possibility of hidden bearish divergence.
The RSI (bearish) has moved way past the equilibrium zone and is currently hovering in the range of 36. An oversold RSI will stimulate buying pressure by those who are keen on buying the dip.
The daily Stochastic RSI (bearish) has transpired a bearish crossover to demonstrate the fact that a bearish trend is intact.
A break from the descending channel can be very bearish for IOTA
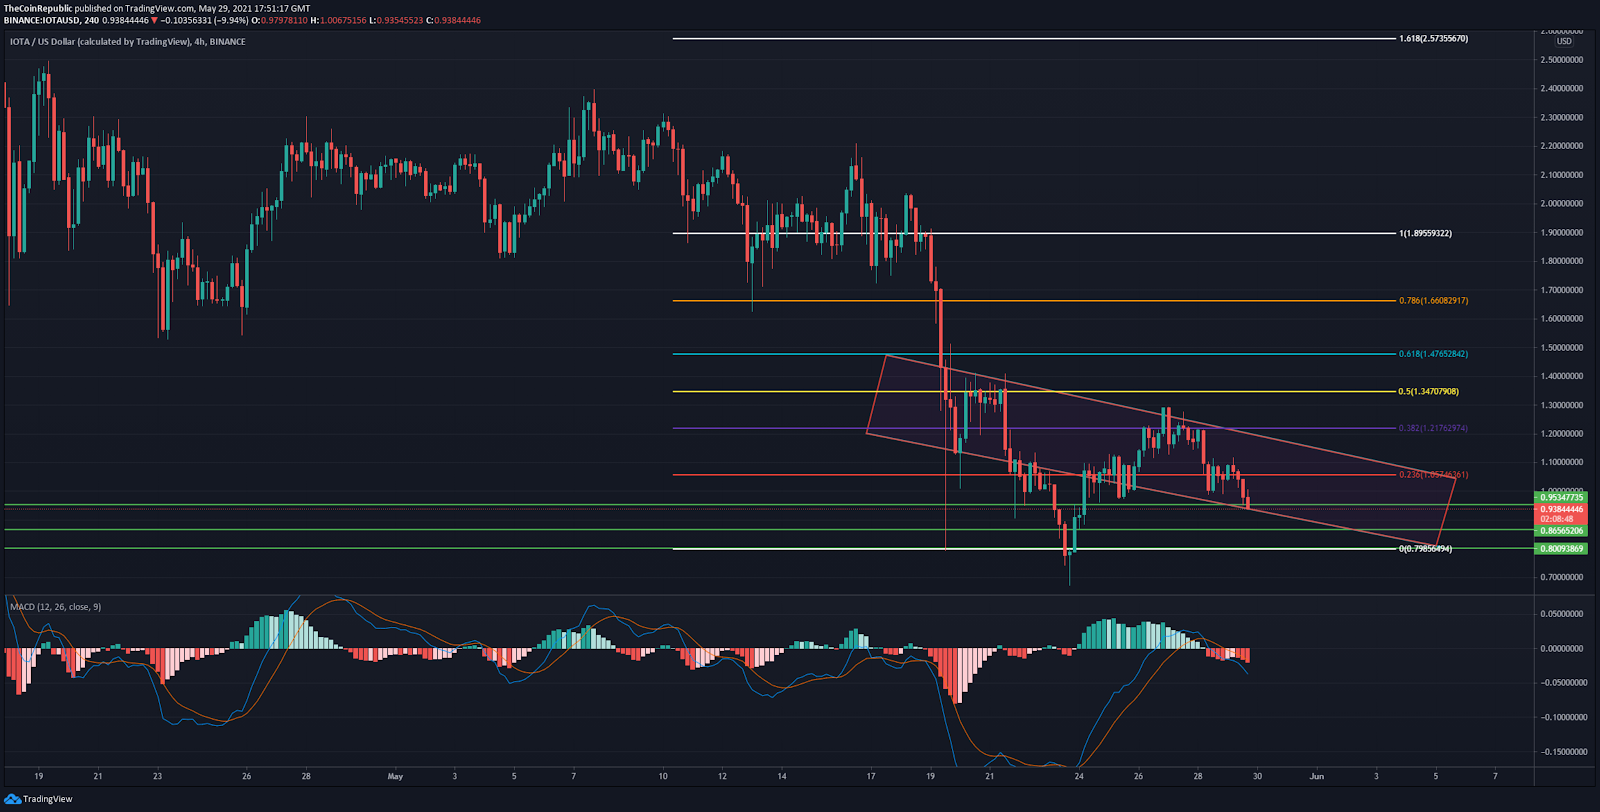
IOTA price action on the 4-hour chart is restricted to a bearish continuation pattern called the descending channel. IOTA kickstarted today’s session by ditching the FIB 0.236 FIB retracement and is currently heading to retrace its previous lows.
The contemporary price region can be classified as a ‘no trend’ phase. The price action is on the threshold of breaking towards the downside from the bearish channel. A confirmed breakout will expose the support levels of $0.86 and $0.80 respectively.
Moreover, if the bearish scenario persists, the price can tough the $0.70 very quickly. A bounceback is only plausible if IOTA holds the current price as support.
The technical indicators have painted a strong sell signal for IOTA. The MACD has entertained a bearish crossover displaying exhaustion with the help of the diminishing histogram inside the negative territory.
CONCLUSION: IOTA needs to hold the mentioned support regions to exhibit recovery. However, a demand region has been established between $0.90 to $0.76 which will impose buying pressure on the token.
Investments in cryptocurrencies are subjected to market risks and extreme price volatility. Investors should conduct due diligence before investing,
SUPPORT: $0.86, $0.80
RESISTANCE: $1.16, $1.32