Polkadot and Solana prices posted deep losses. However, DOT/USDT and SOL/USDT are stabilizing and could resume Q1 2021 trend if $20 and $23, respectively, hold.
Solana (SOL)
The highly functional open-source blockchain offers suitable solutions for DeFi projects. SOL is its main currency.
Past Performance of SOL
Solana technical analysis on the last trading day points to sellers.
There is a high probability of bears pressing lower, in a correction after superb gains of the last five months.
From the daily chart, SOL is down 12 percent against the USD. It is also posting small losses versus ETH and BTC in the same time frame.
Day-Ahead and What to Expect
The SOL/USDT price is within a bear breakout pattern, as the candlestick arrangement in the daily chart shows.
Also, SOL is bearish since prices are within last week’s trade range.
Attempts to rewind losses are futile and with relatively low trading volumes, swinging the trend in favor of sellers.
SOL/USDT Technical Analysis

From the daily chart, SOL has support at $23 and resistance at $40.
Gains above $40 could usher a new wave of demand, potentially causing further expansion towards $58.
On the flip side, losses below immediate support—the 61.8 percent Fibonacci retracement level of the last five months—may trigger a sell-off towards $12 in continuation of last week’s losses.
Polkadot (DOT)
DOT is the main currency of the multi-chain, interoperable and scalable Polkadot network.
Past Performance of DOT
DOT/USDT is trading within a bear breakout pattern, sliding as traders exit their longs.
As of May 29, DOT is trading at around $20, trickling lower and in red versus the USD.
Coming as flashes of hope, trading volumes are steady and within range at around $4.4 billion. This may soak attempts to force DOT lower in upcoming sessions.
Day-Ahead and What to Expect
Aforementioned, DOT sellers have the upper hand, rolling back gains of Q1 2021.
As DOT/USDT technical analysis shows, prices plummeted roughly 40 percent from peaks before stabilizing at around $20.
Presently, DOT prices are inside a $10 zone with resistance and support at $30 and $20, respectively.
DOT/USDT Technical Analysis
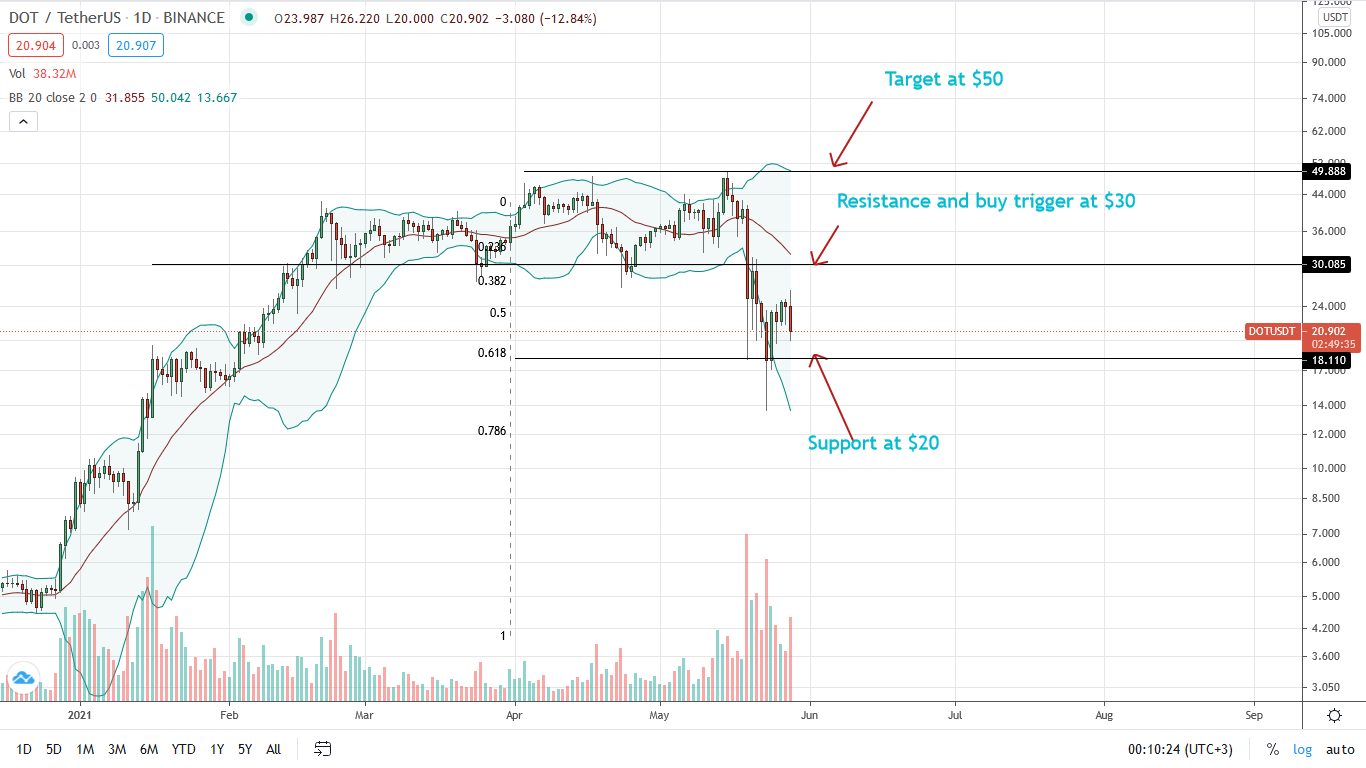
Provided DOT prices are above $20, buyers have the upper hand.
However, since prices are inside May 19 bear candlestick, there is a chance of further breakdown below $20 towards $10—the 78.6 percent Fibonacci retracement level.
On the flip side, sharp gains above $30 with rising volumes may build a foundation for buyers to be optimistic, setting sights at $50.