Polygon is a highly scalable PoS-based blockchain network that brings massive scale to the Ethereum blockchain using a customized version of the Plasma network. Polygon is highly secure, fast, and cost-effective with low transaction costs. Multi-chain interoperability, high throughput, and seamless user experience are other features of this network. MATIC is the native token of this ecosystem. The following MATIC technical analysis will predict the price trends for the next two days:
Past Performance
On May 12, 2021, MATIC started trading at $1.07. On May 18, 2021, MATIC closed at $2.44. Thus, in the past week, the MATIC price has skyrocketed by roughly 128%. In the last 24 hours, MATIC has traded between $2.09-$2.51.
https://s3.tradingview.com/snapshots/r/RzmTCK90.png
Day-Ahead and Tomorrow
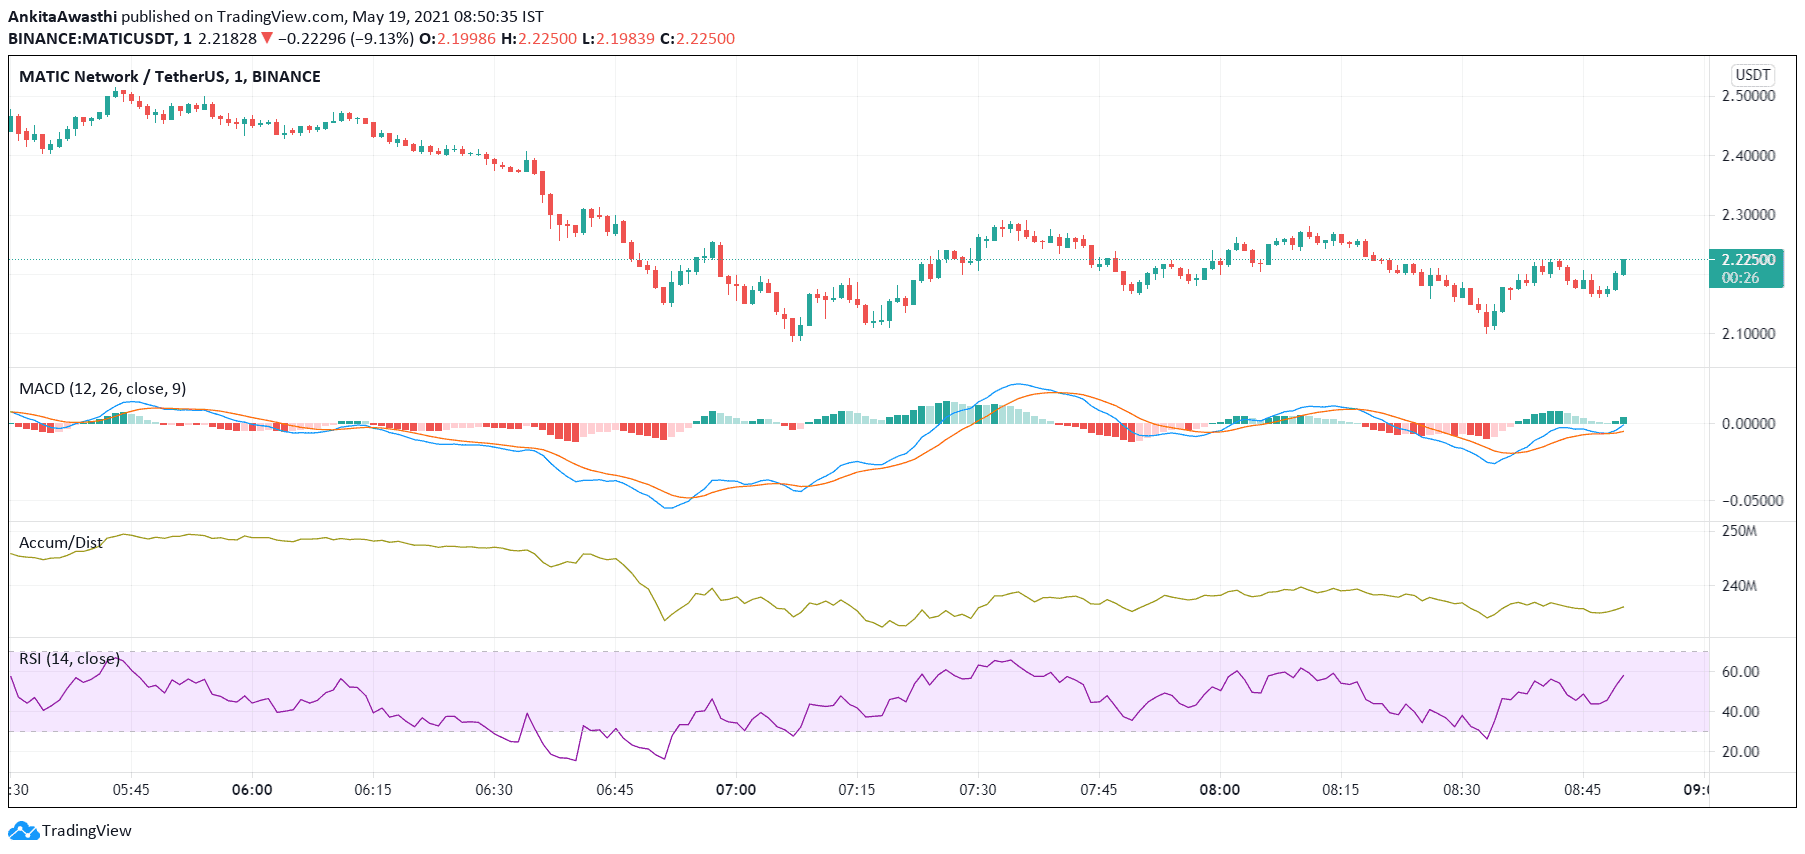
Currently, MATIC is trading at $2.22. The price has decreased from the day’s opening price of $2.44. Thus, the market seems to be bearish.
The MACD and signal lines are negative. Thus, the overall market momentum is bearish. However, a bullish crossover by the MACD line over the signal line has occurred. Moreover, both the lines are close to the zero line and may turn positive soon. Hence, a bearish trend reversal may be on the anvil.
Currently, the RSI indicator is at 60%. It faced rejection at 43% and rose to this level. Thus, buying pressures are high. In other words, the RSI indicator is also pointing towards a price rise like the MACD oscillator.
However, the A/D indicator has fallen steeply. Thus, distribution activity is much higher than accumulation activity. Hence, the A/D indicator is showing bearish signals. But, when we look at it in conjunction with the other indicators, we can say that the price may decline for some more time and then start rising.
MATIC Technical Analysis
Currently, the price is below the Fibonacci pivot point of $2.34. It may soon fall below the first and second support levels of $2.19 and $2.08, respectively. Thereafter, we have to wait and watch if the price starts rising.
The price has tested and fallen below the 38.2% FIB retracement level of $2.25. It may soon fall below the 23.6% FIB retracement level of $2.19 as well. If the price retests and breaks out of these levels in some time, then probably a price uptrend has set in. In that case, we can expect the price to continue rising tomorrow as well.