Yearn.finance is a Defi aggregator that uses automation to facilitate investors to maximize their gains from yield farming. This platform has launched innovative products in the recent past and enables users to gain 73% more in weekly fees staking. YFI is the native token of this ecosystem. The following YFI technical analysis will predict the price trends for the next two days:
Past Performance
On May 8, 2021, YFI started trading at $53,368.33. On May 14, 2021, YFI closed at $77,676.94. Thus, in the past week, the YFI price has increased by approximately 46%. In the past 24 hours, YFI has traded between $74,549.90-$79,307.18.
https://s3.tradingview.com/snapshots/r/RnkPMFJe.png
Day-Ahead and Tomorrow
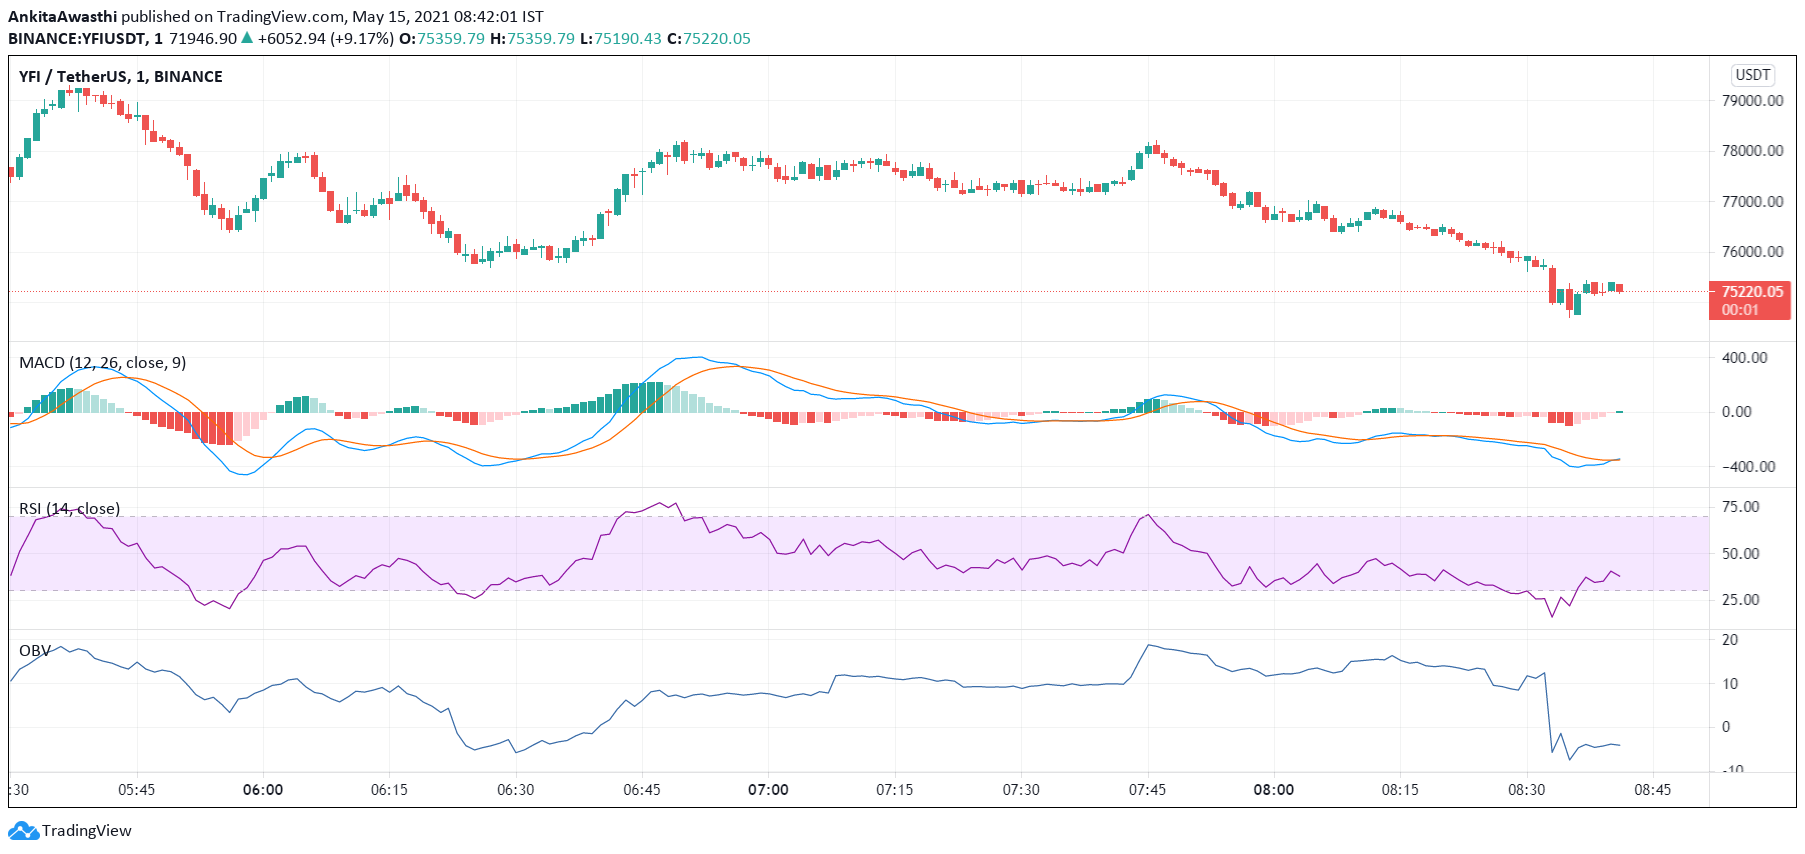
Currently, YFI is trading at $75,220.05. The price has decreased from the day’s opening price of $77,676.94. Thus, the market seems to be bearish.
The MACD and signal lines are negative. Thus, the overall market momentum is negative. However, a bullish crossover by the MACD line over the signal line has occurred. Hence, the YFI market is in a price correction phase, and we can expect intermittent price rises amidst an overall bearish trend.
Currently, the RSI indicator is at 29% in the ‘oversold’ region. Hence, selling pressures are very high. Therefore, like the MACD indicator, the RSI indicator is also pointing at a negative price trend.
Besides, the OBV indicator has fallen steeply. In other words, selling volumes are much higher than the selling volumes. Thus, the OBV indicator is giving further credence to a price downtrend shown by the other oscillators.
YFI Technical Analysis
Currently, the price has fallen below the first Fibonacci pivot support level of $75,360.72. The price has further fallen below the subsequent support levels of $74,238 and $72,420.73, respectively.
The price has tested and fallen below the 23.6% FIB retracement level of $75,672.62. The price is soon likely to fall below the 23.6% FIB extension level of $73,427.18. Thus, the price downtrend seems strong and is expected to continue tomorrow as well.