Polygon is a PoS-based blockchain network that facilitates instant transactions and brings about massive scalability to the Ethereum blockchain. As per recent news, Polygon is now aiming to launch a product to resolve scalability issues on multiple blockchains due to heavy congestion of distributed ledgers by various altcoins. Thus, the market sentiment towards MATIC has turned positive and is reflecting in its price as well and the technical analysis is as follows:
Past Performance
On May 8, 2021, MATIC started trading at $0.75. On May 14, 2021, MATIC closed at $1.47. Thus, in the past week, the MATIC price has surged by roughly 96%. In the past 24 hours, MATIC has traded between $1.46-$1.80.
https://s3.tradingview.com/snapshots/d/Du35oMRF.png
Day-Ahead and Tomorrow
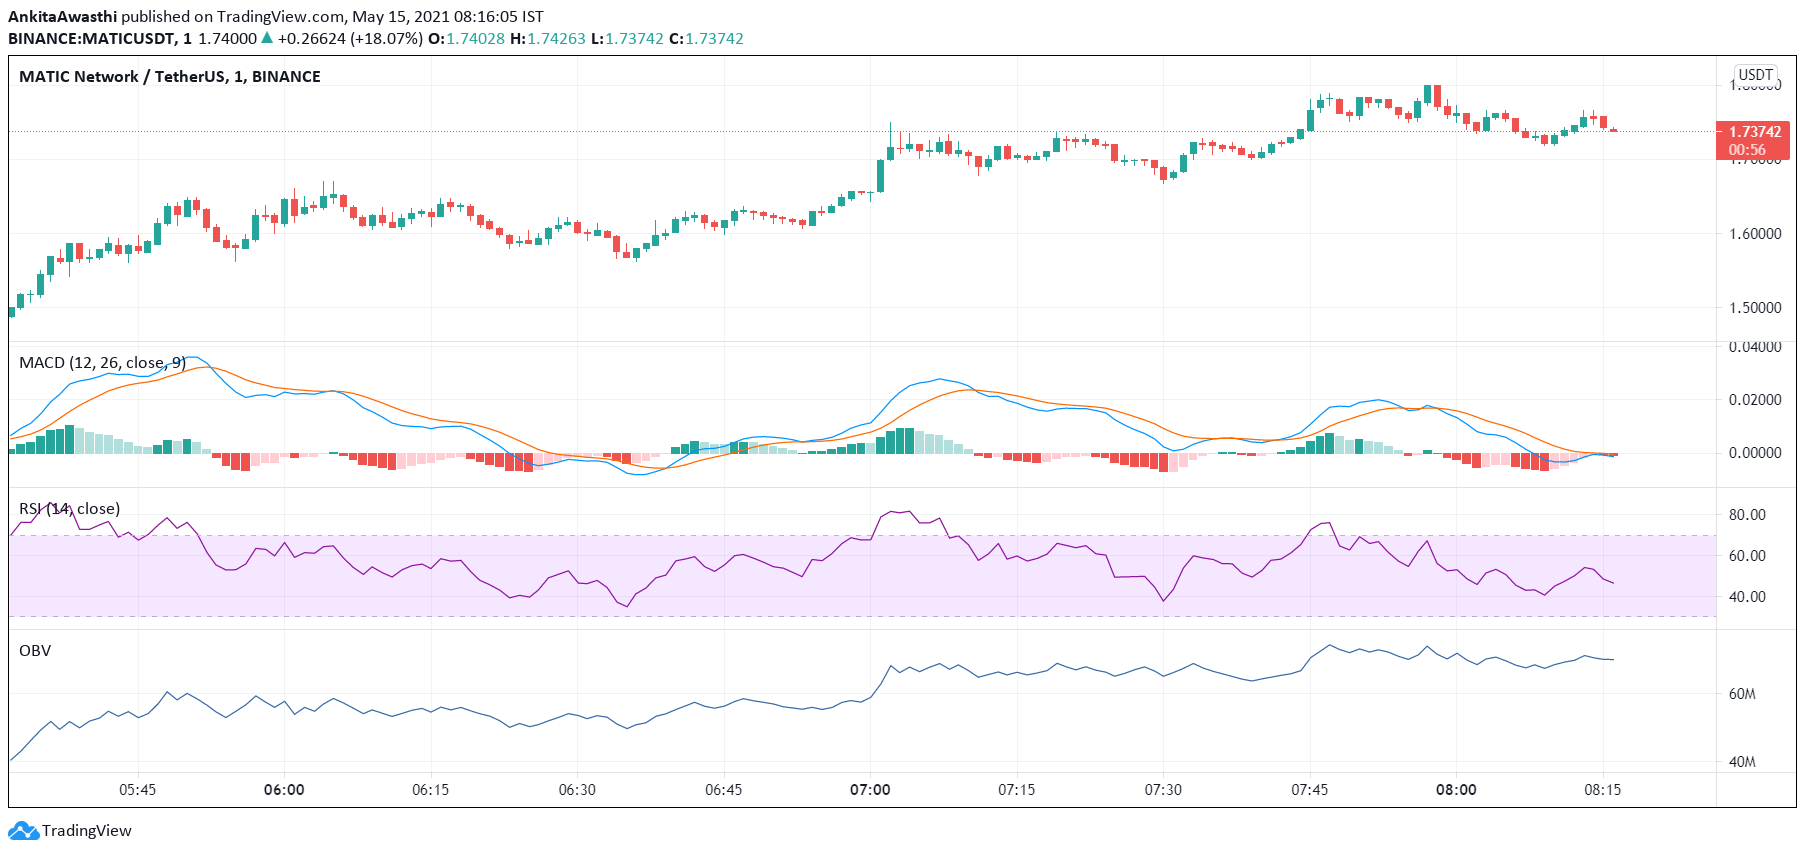
Currently, MATIC is trading at $1.74. The price has increased from the day’s opening price of $1.47. Thus, the market seems to be healthy.
The MACD and signal line have just turned negative. Moreover, a bearish crossover by the MACD line over the signal line has also occurred. Hence, the overall market momentum is bearish. Thus, the price is likely to start falling.
Currently, the RSI indicator is at 52%. It faced rejection at 46% and rose to this level. Thus, buying pressures are slowly mounting. Thus, when we look at the RSI indicator in conjunction with the MACD oscillator, we can say that the price may start rising again after an intermittent price pullback.
Besides, the OBV indicator is upward sloping implying that buying volumes are higher than selling volumes. Hence, the price uptrend is strong.
In short, looking at all the oscillators together, we can say that the price is poised to rise further after a brief price pullback.
MATIC Technical Analysis
Currently, the price is above the first Fibonacci pivot resistance level of $1.71. The price may fall up to the first resistance level before rising again. By day end, if bulls remain strong, we can expect the price to surpass the subsequent resistance levels of $1.79 and $1.92, respectively.
The price is soon likely to retest and fall below the 23.6% FIB retracement level of $1.72. It may further fall below the 38.2% FIB retracement level of $1.67. Thereafter, we have to wait and watch if the price retests and breaks out of these levels by day end. In that case, the bullish trend is expected to continue tomorrow as well.