GRT/USDT prices are oscillating between $1.3 and $2.2, but buyers are in control. On the other hand, the Polkastarter technical analysis suggests sell pressure. However, POLS/USDT bulls have a chance if prices break above $5.
Polkastarter (POLS)
Projects seeking to deploy and benefit from cross-chain pools and auction can do so from Polkastarter. POLS is the dApp’s utility and governance token.
Past Performance of POLS
The POLS/USDT price continues to track lower, capped below a multi-week resistance trend line as price action in the daily chart reveals.
POLS is down roughly four percent against BTC and USD, and eight percent versus ETH on the last trading day.
Meanwhile, trading volumes are down 15 percent to $54 million.
Day-Ahead and What to Expect
Technical candlestick arrangement favors bears in the immediate term.
The main liquidation level is the multi-week resistance trend line and April 2021 highs at $5.
Also, reversal of April 10 gains and losses below $3 could see the POLS/USDT price slump towards $2.
POLS/USDT Technical Analysis
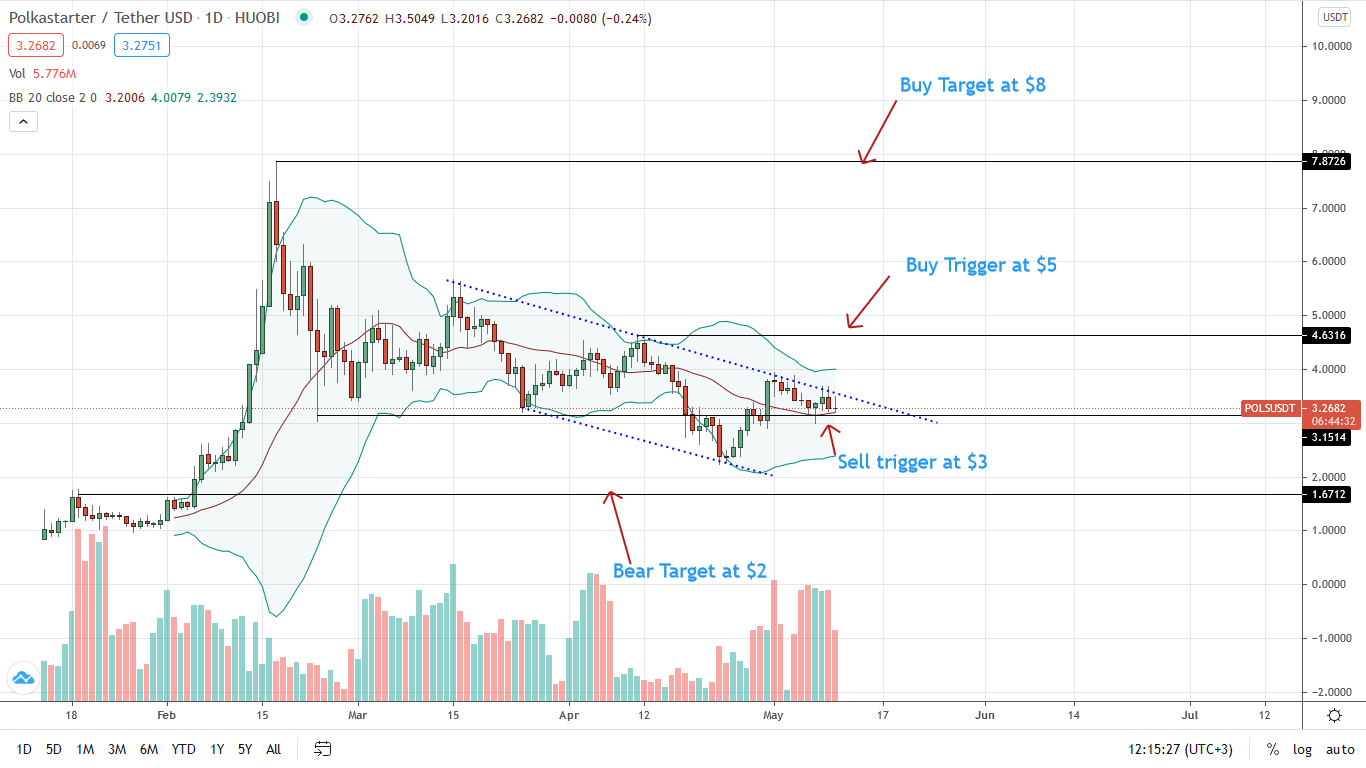
POLS technical analysis indicates bears in largely bullish price action. Notably, POLS/USDT prices are trending inside a descending channel, a bull flag.
For buyers to take charge, there must be concerted efforts to push for a close above the primary trend line and $5, as aforementioned.
In that case, the first POLS buy target will be $8. Liquidation below $3—and April 30 low—may trigger a sell-off towards $2.
The Graph Protocol (GRT)
The Graph is an indexing protocol where users can query and extract data from public chains like Ethereum and IPFS. It is built around the GRT utility token.
Past Performance for the GRT
The GRT/USDT price remains in range, bouncing off from March 2021 lows, but within a bullish trend. GRT buyers have the upper hand judging from candlestick arrangements.
On the last trading day, the GRT price is relatively stable versus BTC and USD, sliding against ETH.
At the same time, trading volumes are within average, at $181 million.
Day-Ahead and What to Expect
GRT/USDT technical analysis reveals a ranging market.
Reaction levels are at $1.3 and $2.2, respectively. Even so, GRT buyers remain in control provided $1.3—primary support holds.
GRT price surges above $1.7–May 2021 highs–may see GRT/USDT rally towards the upper range at $2.2.
GRT/USDT Technical Analysis
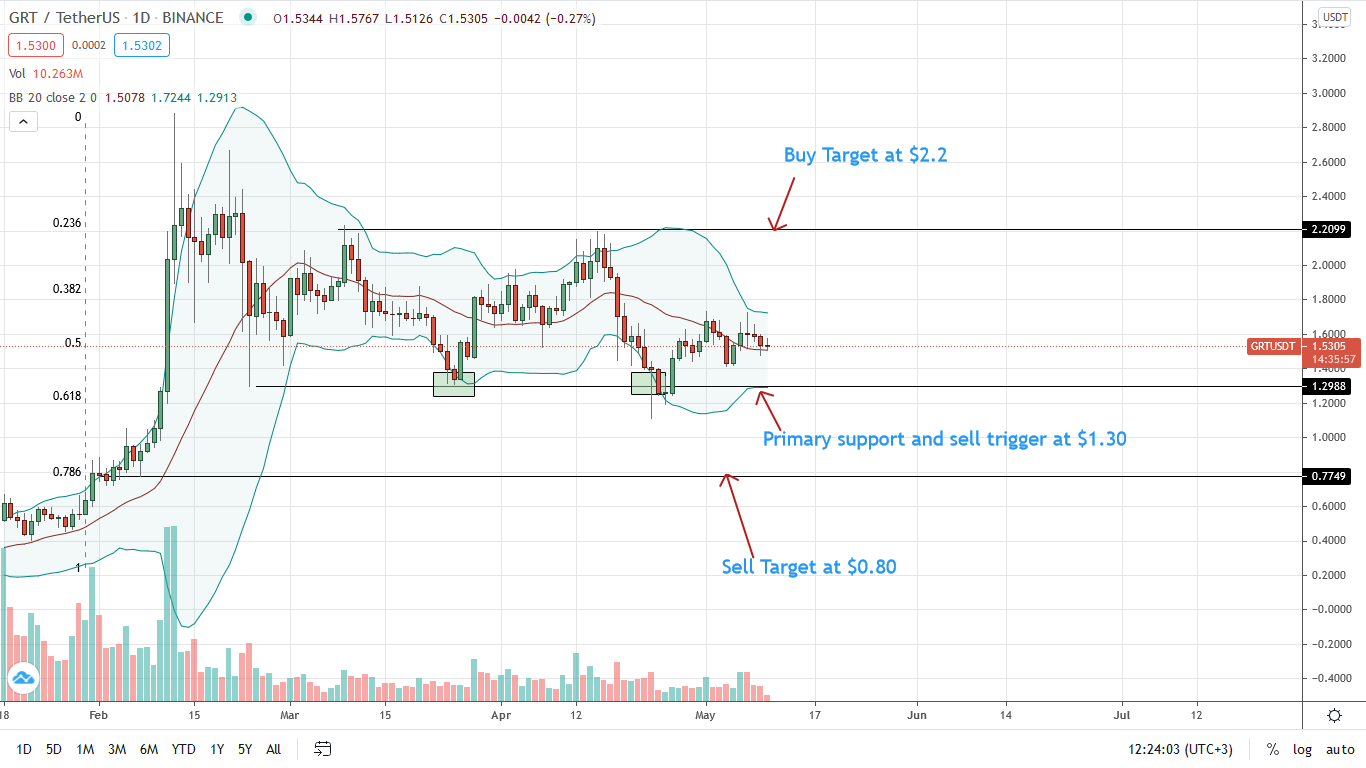
The uptrend is valid as long as $1.3—March and April 2021 lows—hold. A close above $1.7—or May 2021 high—may catalyze demand.
In that case, the first feasible buy target for GRT/USDT bulls remains at $2.2.
Hence, if GRT drop below $1.3, prices may trend towards $0.80 in the immediate term in continuation of late April 2021 losses.