Tezos is a blockchain-based platform for the development of decentralized apps. Smart contract security, easy upgradability, high scalability, and open participation are striking features of this network. XTZ is the native token of this ecosystem. The XTZ technical analysis is as follows:
Past Performance
On April 30, XTZ opened at $5.24. On May 6, 2021, XTZ closed at $7.57. Thus, in the past week, the XTZ price has soared by roughly 44%. In the last 24 hours, XTZ has traded between $7.29-$8.42.
https://s3.tradingview.com/snapshots/v/VDHE53ne.png
Day-Ahead and Tomorrow
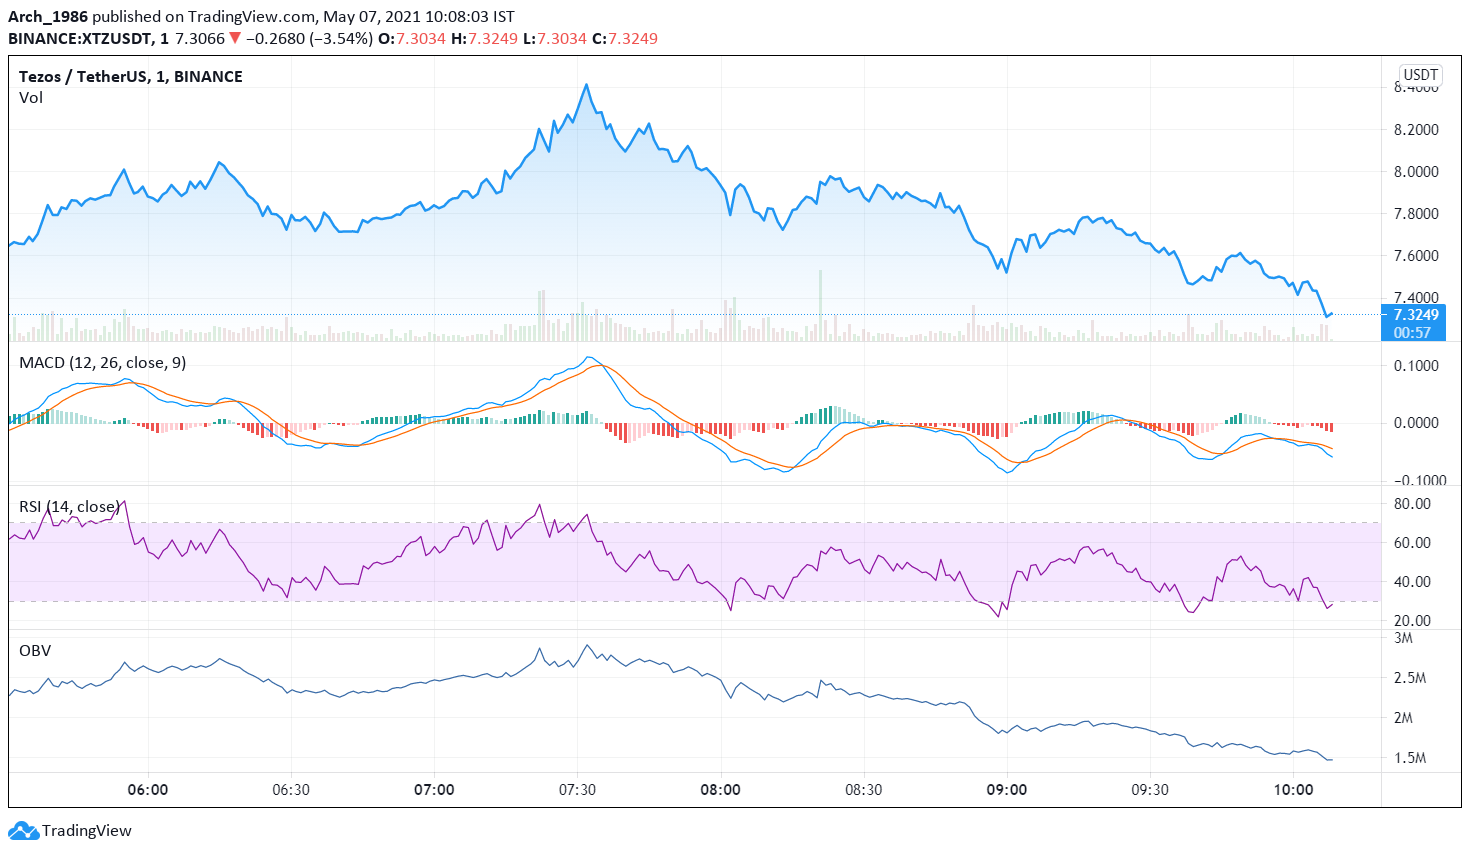
Currently, XTZ is trading at $7.32. The price has declined from the day’s opening price of $7.58. Thus, the market seems to be downtick.
The MACD and signal lines are negative. Moreover, a bearish crossover by the MACD line over the signal line has occurred. Thus, the overall market momentum is bearish. Hence, we can expect the price to decline further.
The RSI indicator is currently at 40% and has just risen from the oversold region. Thus, the selling pressures are high. Therefore, the RSI indicator is giving further credence to a bearish trend pointed by the MACD oscillator.
The OBV indicator has fallen steeply. Hence, selling volumes are higher than buying volumes. Heavy selling activity will push the price downwards. In short, all three oscillators have indicated a bearish market trend.
XTZ Technical Analysis
The price has fallen below the Fibonacci pivot point of $7.78. By day end, the price may fall below the subsequent support levels of $7.32, $7.04, and $6.59, respectively.
The price has tested and fallen below the 23.6% FIB retracement level of $7.56. Thus, the bears are strong, and the price downswing is likely to continue tomorrow as well.