|
|
Bitcoin Gold (BTG) is an altcoin that was hard-forked from the Bitcoin codebase. It is an open-source, peer-reviewed, and decentralized blockchain network. This network has launched a new mining algorithm known as Equihash BTG. The resulting BTG technical analysis determines the price for the next couple of days:
Past Performance
On April 29, 2021, BTG opened at $93.15. On May 5, 2021, BTG closed at $133.15. Thus, in the past week, the BTG price has surged by roughly 43%. In the last 24 hours, BTG has traded between $133.15-$169.
https://s3.tradingview.com/snapshots/i/ItyKsSQq.png
Day-Ahead and Tomorrow
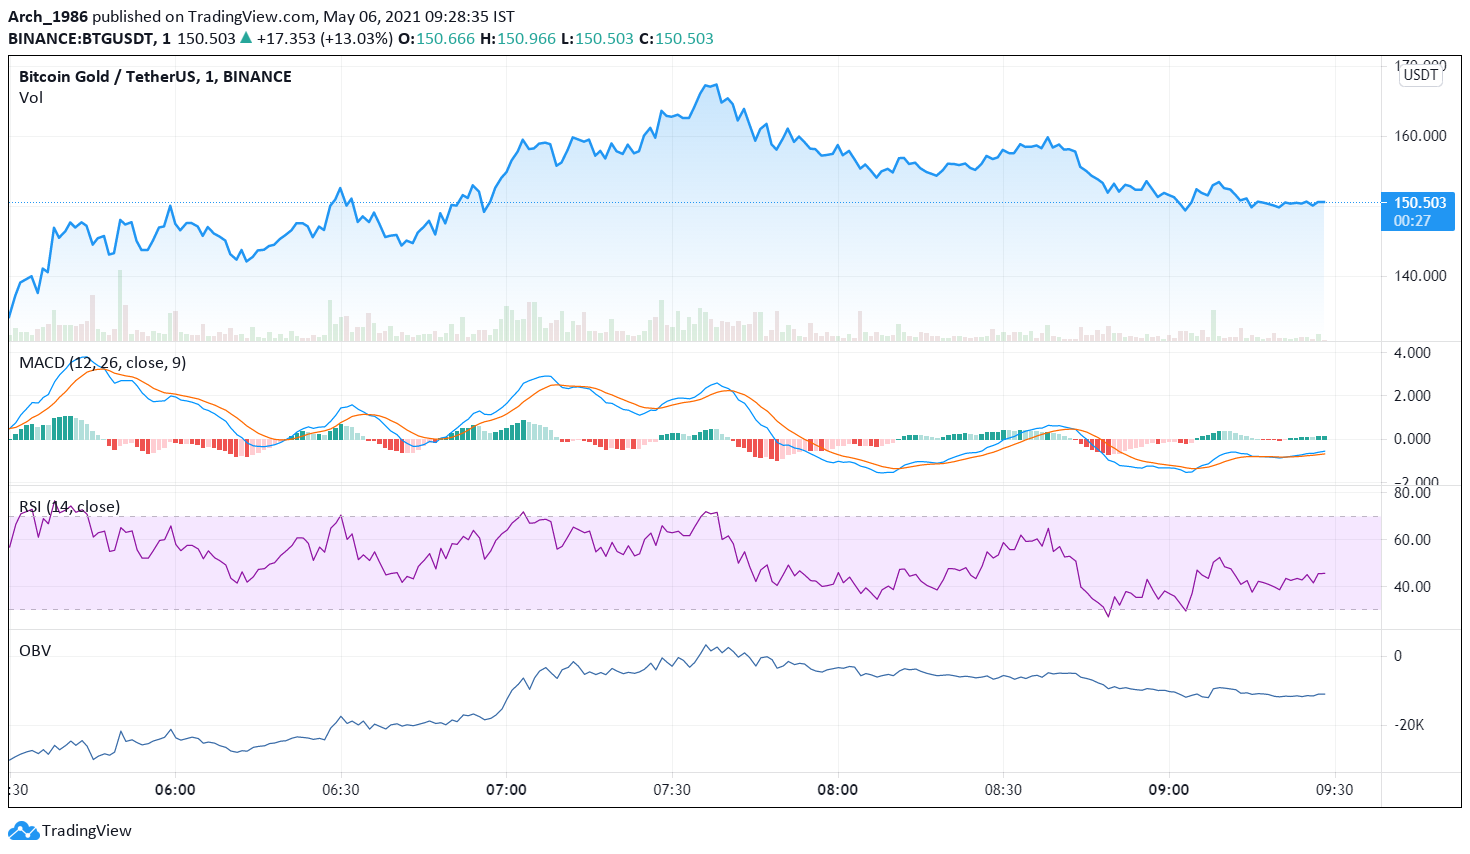
Currently, BTG is trading at $150.50. The price has risen from the day’s opening price of $133.15. Thus, the market seems to be uptick.
The MACD and signal lines are negative. Hence, the overall market momentum is bearish. However, a bullish crossover by the MACD line over the signal line has occurred. The lines are also inching closer to the zero line. Hence, a bearish trend reversal may be on the horizon.
The RSI indicator is presently at 56%. It faced rejection at 43% and rallied to the current level. Hence, buying pressures are gradually increasing. This implies that the RSI indicator is giving further credence to the bearish trend reversal indicated by the MACD oscillator. Hence, we can expect the price to rise further.
Besides, the OBV indicator has started rising steadily. Thus, buying volumes are slowly surpassing selling volumes. Hence, the price is likely to go up further. In short, all three oscillators have given positive signals.
BTG Technical Analysis
Currently, the price is above the Fibonacci pivot point of $145.10. It may soon break out of the first Fibonacci pivot resistance level of $158.79. If the bulls remain strong till day end, the price is likely to breach the subsequent resistance levels of $167 and $180.95, respectively.
The price is soon likely to test and break out of the 38.2% FIB retracement level of $155.30. In some time, if the price surpasses the 23.6% FIB retracement level of $160.54, then the bulls are strong. In that case, the price upswing may continue tomorrow as well.