Sia is a blockchain-based cloud storage platform. It is a decentralized data storage network that requires no signups, servers, or third-party interfaces. It is a highly redundant, cost-efficient, and secured ecosystem. SC is the native token of this network and the technical analysis is as follows:
Past Performance
As suggested in the previous SC technical analysis, the price rallied massively. On April 29, 2021, SC started trading at $0.039. On May 5, 2021, SC closed at $0.041. Thus, in the past week, the SC price has risen by approximately 5%. In the last 24 hours, SC has traded between $0.04-$0.042.
https://s3.tradingview.com/snapshots/k/KXvT2gyW.png
Day-Ahead and Tomorrow
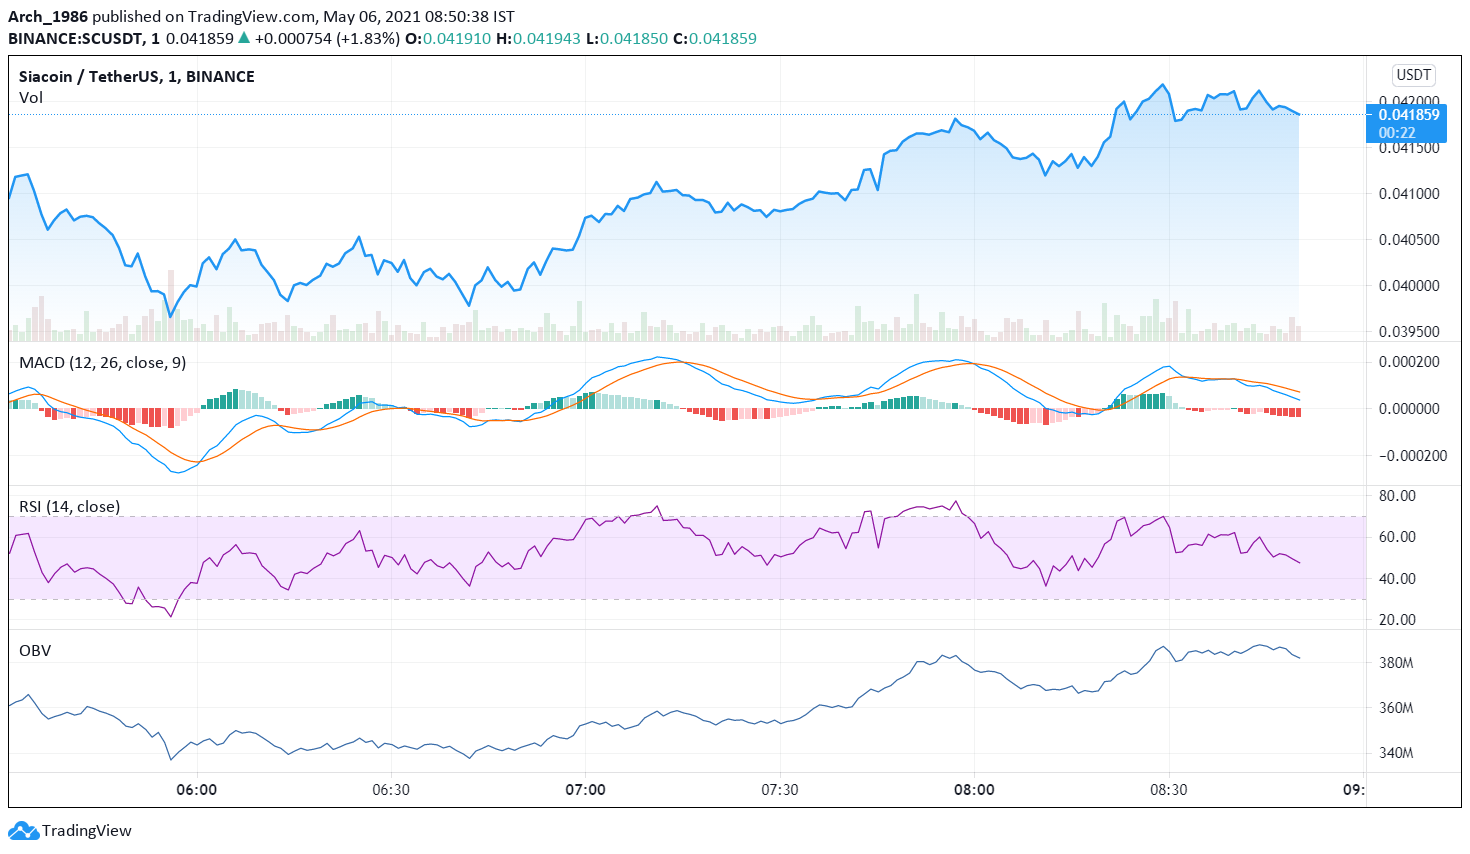
Currently, SC is trading at $0.042. The price has increased slightly from the day’s opening price of $0.041. Thus, the market seems to be uptick.
The MACD and signal lines are currently positive but may turn negative soon as they are very close to the zero line. Moreover, a bearish crossover by the MACD line over the signal line has occurred. Hence, the overall market momentum is turning bearish.
Therefore, we can expect the SC price to start declining.
Presently, the RSI indicator is at 41%. It faced rejection at 46% and fell to the current level. Thus, selling pressures are high. Hence, like the MACD indicator, the RSI indicator too is pointing towards a price dip.
For the past few minutes, the OBV indicator has been falling steadily. This implies that selling volumes are slowly overtaking the buying volumes. In other words, the OBV indicator is giving further credence to a price pullback indicated by the other two oscillators.
SC Technical Analysis
Currently, the price is trading above the Fibonacci pivot point of $0.041. It may soon fall below the pivot point and further below the first support level of $0.04. If the bears remain strong, then the price may fall below the subsequent support levels of $0.0398 and $0.039, respectively, in some time.
Presently, the price has tested and broken out of the 23.6% FIB retracement level of $0.0415. However, since the oscillators have given bearish signals, the price may retest and fall below this level. We have to wait and watch to see if the price pullback is temporary or a trend reversal has occurred. If a trend reversal has occurred, then the price may continue to fall tomorrow as well.