- BAT coin price fell more than 40% before finding support near the trendline.
- BAT coin is trading above the major EMAs but the declining volume and the loss in momentum are increasing the bearish sentiment.
- The BAT/BTC pair is trading at 0.0000222 BTC with an intraday growth of 1.58%.
source-tradingview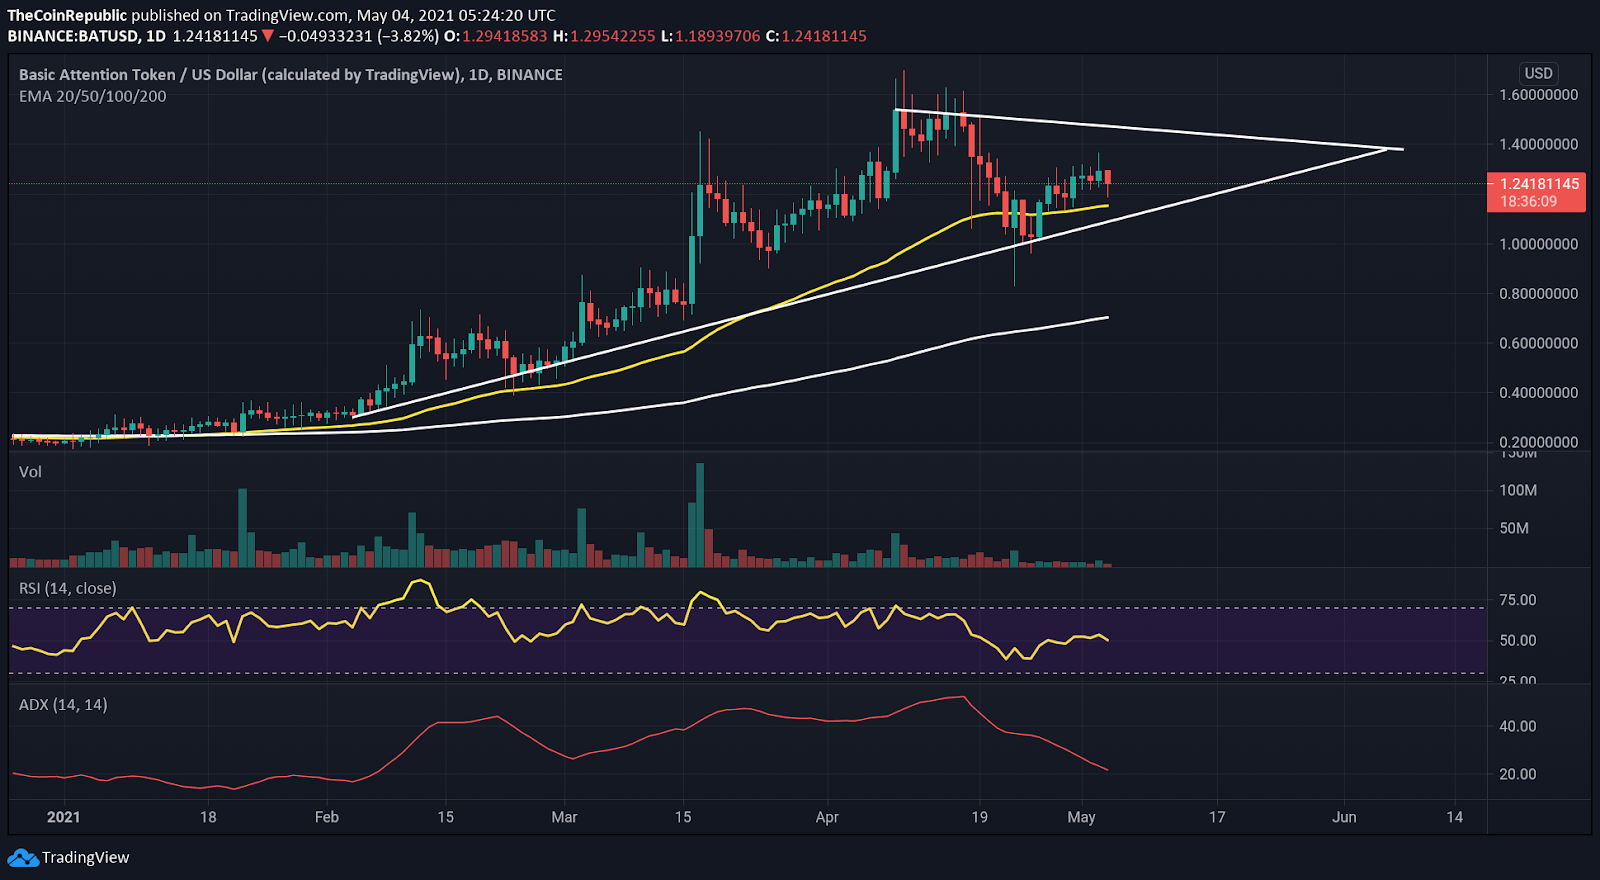
The basic attention token is rising higher with the support triangle, but the supply dump near $1.54 resulted in the price reversal from there to the support level of $1.00. The coin price is heading higher for the moment above the 50 EMA.
The symmetrical triangle pattern observed might initiate the bull run to create a New All-time High after the breakout.
Volumes are on the lower side, but they might increase on breakout; otherwise, the chances of price reversal can increase. The live BAT price today is $1.24, with a 24-hour trading volume of $462,085,743. The price is down 2.08% in the last 24 hours with a market capitalization of $1,852,795,943.
Ascending triangle with Golden Bullish Crossover
source-tradingview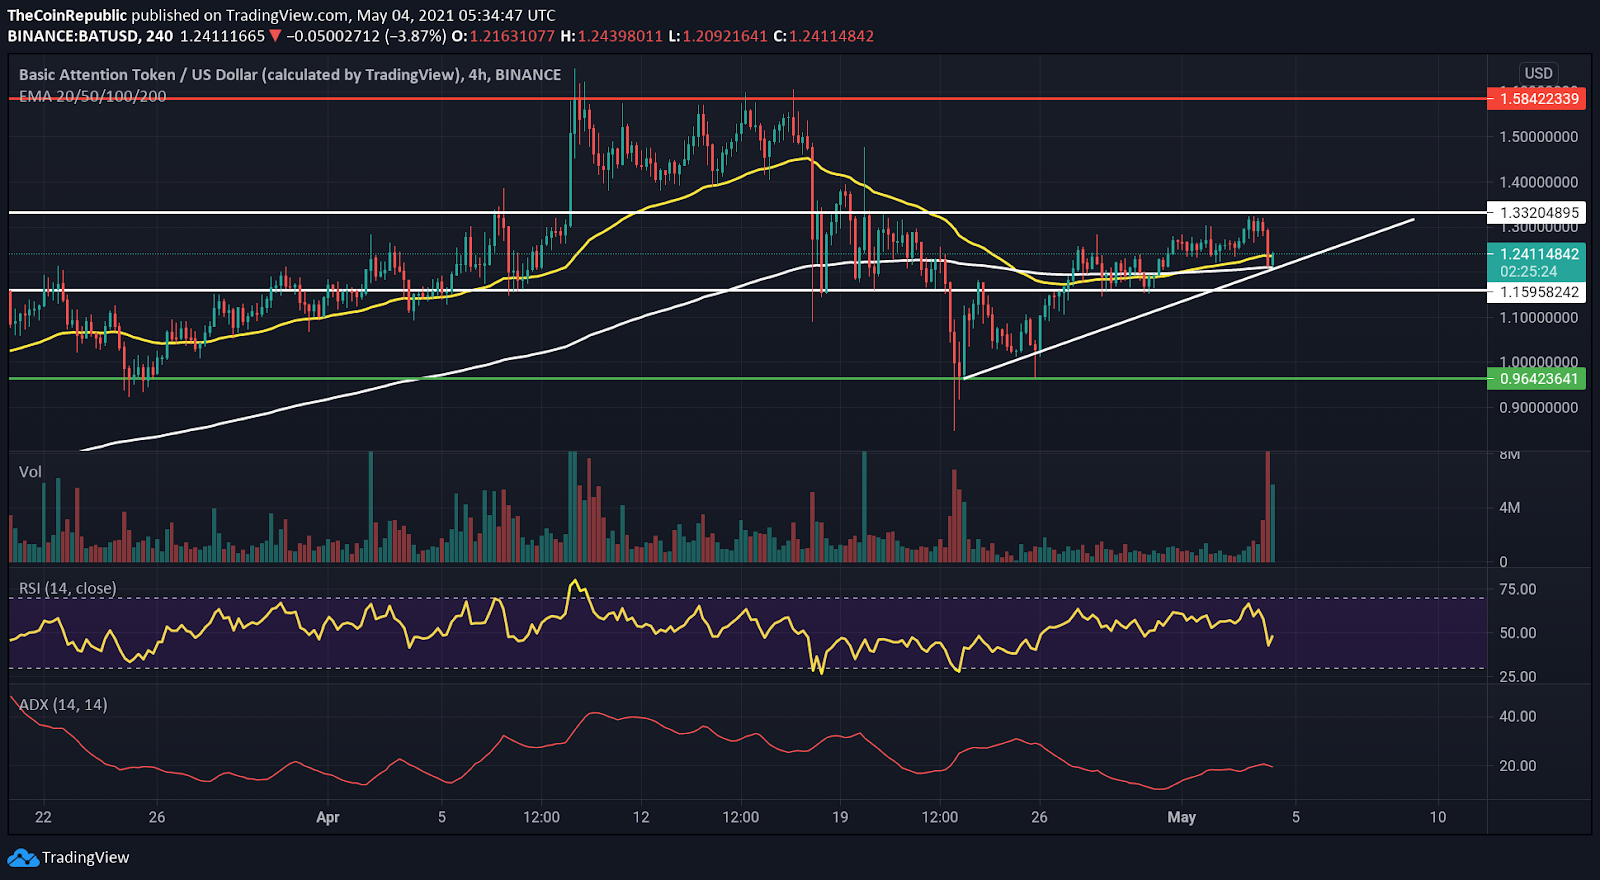
In the 4-hour timeframe, BAT coin price is rising higher with the help of the support trendline. The increased selling volume is posing a threat to the bulls. Longtails formed near the 200 EMA might push the price up to form a breakout.
An up move of 10-15% could be expected if volume supports the breakout of the $1.33 level. However, if the prices fall below the support trendline, then the level near $1.00 would be the next prominent support for the price.
As per the 4-hour timeframe, the relative strength indicator is trading at 48 and rising higher to the overbought zone, which might forecast the breakout. The coin volume is below average for now, but increased selling volume could result in a fallout.
50 EMA (yellow) is intermingled with the 200 EMA, and both are providing support to the price in the 4-hour timeframe. However, 50 EMA is rising higher, indicating a Golden Bullish Crossover.
ADX indicator is trading at 19, and the slope is rising higher, implying a stronger trend momentum.
CONCLUSION- Breakout of the resistance level of $1.33 could be a great entry initiative, but one must be careful and wait for a retest. If the ascending triangle pattern fails, then the next prominent support levels could be 50 EMA, and after that, the $1.15 and $1.00 levels.
SUPPORT LEVEL – $1.15 and $1.00
RESISTANCE level – $1.33 and $1.58