Ontology is an open-source protocol that specializes in decentralized self-sovereign data and identity. It provides a robust infrastructure for cross-chain interactions if highly scalable. It enables users to create customized blockchains. ONT is the native token of this ecosystem. The following ONT technical analysis will predict the price movements for the next two days:
Past Performance
On April 27, 2021, ONT opened at $1.58. On May 3, 2021, ONT closed at $1.93. Thus, in the past week, the ONT price surged by roughly 22%. In the last 24 hours, ONT has traded between $1.74-$1.94.
https://s3.tradingview.com/snapshots/c/ctEGM1N7.png
Day-ahead and tomorrow
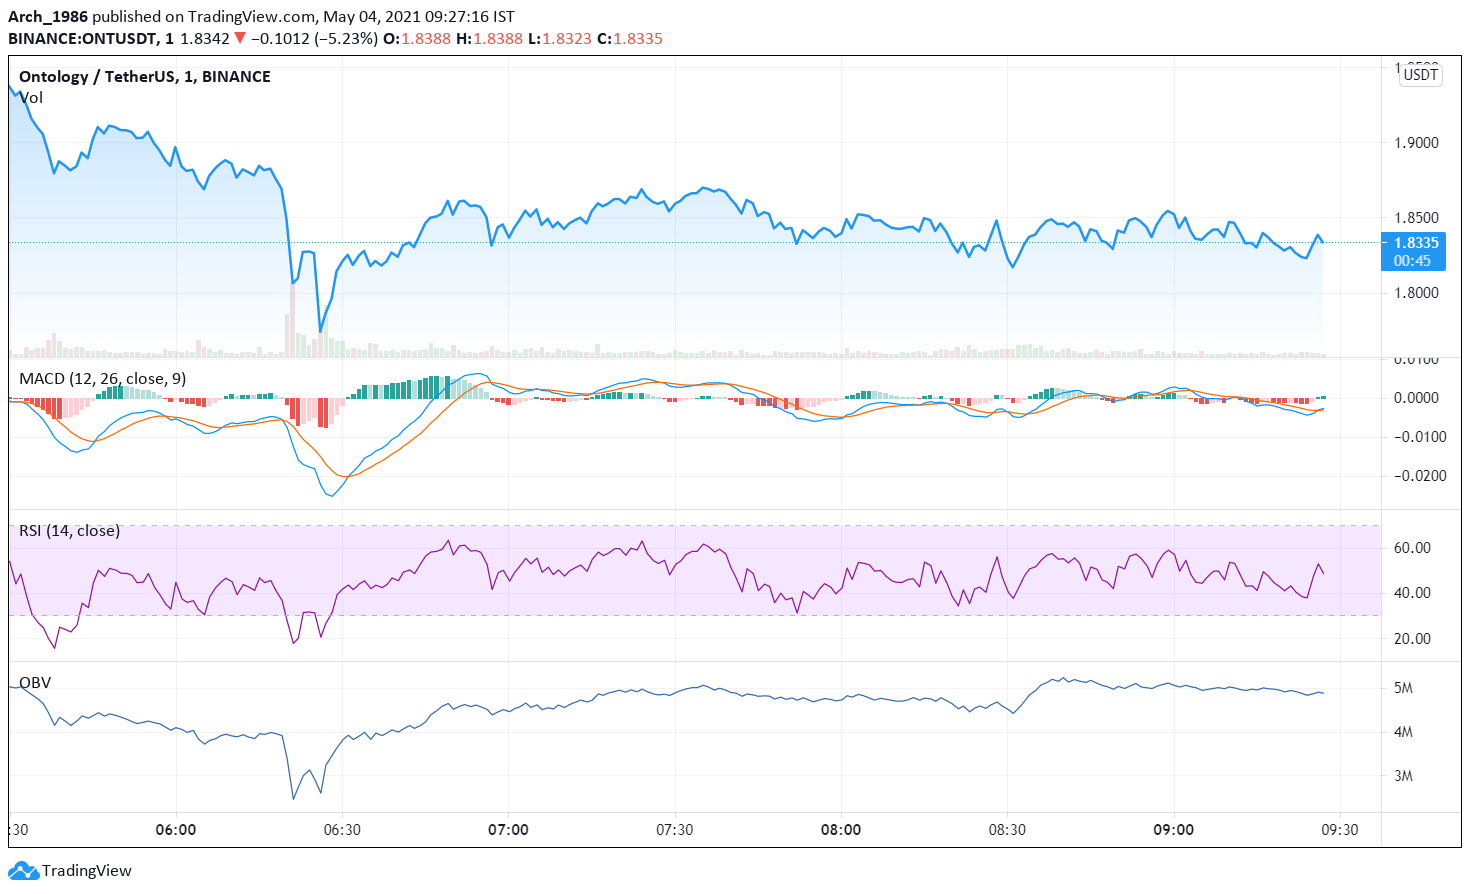
Currently, ONT is trading at $1.83. The price has fallen from the day’s opening price of $1.93. Thus, the market seems to be downtick.
The RSI indicator is currently at 54%. It faced rejection at 38% and rose to the current level. Thus, buying pressures are slowly increasing. Hence, we can expect the price to start rising in some time.
The MACD and signal lines are negative. Thus, the overall market momentum is bearish. However, both the lines are close to the zero line and may become positive soon. Moreover, a bullish crossover by the MACD line over the signal line has occurred. Thus, the MACD oscillator is pointing towards an impending price rise.
The OBV indicator is upward sloping. Thus, buying volumes are higher than selling volumes. Hence, like the other oscillators, the OBV indicator is pointing towards a price rise. Thus, the overall market momentum is turning bullish.
ONT Technical Analysis
Currently, the price is below the Fibonacci pivot point of $1.87. The price may soon rise above the pivot point. Thereafter, we have to wait and watch to see if the price breaks out of the first resistance level of $1.95, to confirm a bearish trend reversal.
The price has tested and broken out of the 61.8% FIB retracement level of $1.86. The price may soon test and break out of the 76.4% FIB retracement level of $1.89. Thus, as of now, it seems bulls are gaining strength. In that case, the price upswing may continue today as well as tomorrow.