Bitcoin SV is a public blockchain network hard-forked from the Bitcoin blockchain. It provides a robust platform and advanced tools that enable users to develop decentralized apps and smart contracts. It is a fast, secure, and highly scalable network that facilitates micro-payments in digital money. The BSV technical analysis is as follows:
Past Performance
On April 27, 2021, BSV opened at $264.89. On May 3, 2021, BSV closed at $362.96. Thus, in the past week, the BSV price surged by approximately 37%. In the last 24 hours, BSV has traded between $335.47-$377.73.
https://s3.tradingview.com/snapshots/p/pvxwo1Ja.png
Day-Ahead and Tomorrow
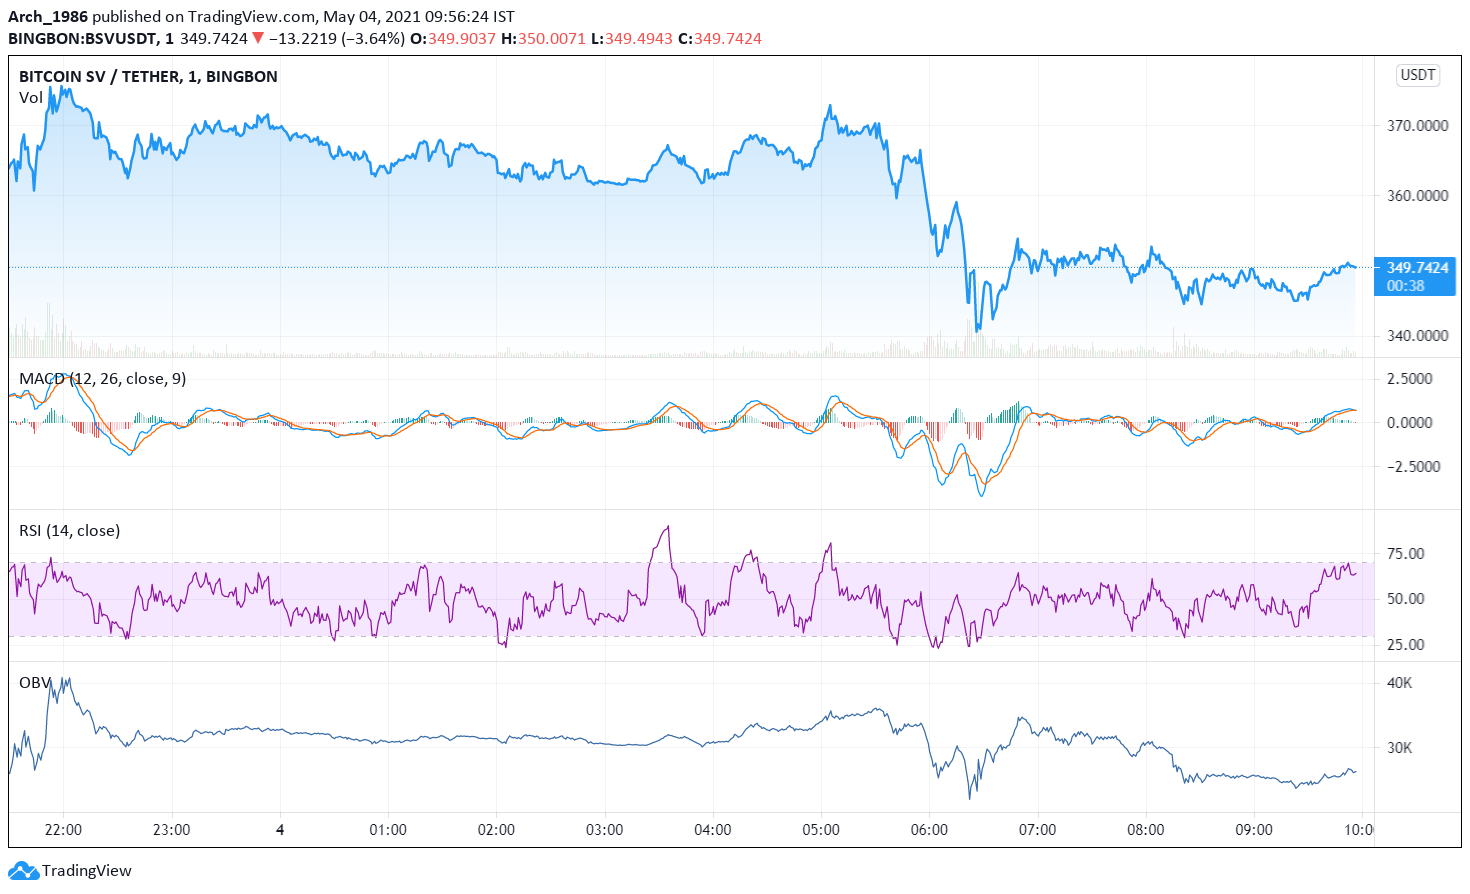
Currently, BSV is trading at $349.74. The price has decreased from the day’s opening price of $363.05. Thus, the market seems to be downtick.
The MACD and signal lines are positive. Thus, the overall market momentum seems bullish. However, a bearish crossover by the MACD line over the signal line has occurred. Hence, the price may dip for some time before starting to rise.
The RSI indicator faced rejection at 55% and is currently at 47%. Thus, selling pressures are high. Hence, like the MACD oscillator, the RSI indicator is pointing towards a further price pullback.
The OBV indicator has fallen steeply. This implies that selling volumes are higher than buying volumes. High selling activity will push the BSV price further down.
To sum up, all the oscillators have indicated a price decline. Thereafter, we have to wait and watch if a bearish trend reversal occurs as the MACD oscillator has given indications of the same.
BSV Technical Analysis
The price has presently fallen below the Fibonacci pivot point of $358.72. The price may soon fall below the first support level of $342.58. Thereafter, we have to wait and watch if the price starts rising or falls further down.
The price has tested and fallen below the 38.2% FIB retracement level of $351.61. It may soon fall below the 23.6% FIB retracement level of $345.44 as well. Thus, as of now, the bears are strong. We have to wait till the day ends to see if a price uptrend sets in. Consequently, the bullish trend may continue tomorrow as well.