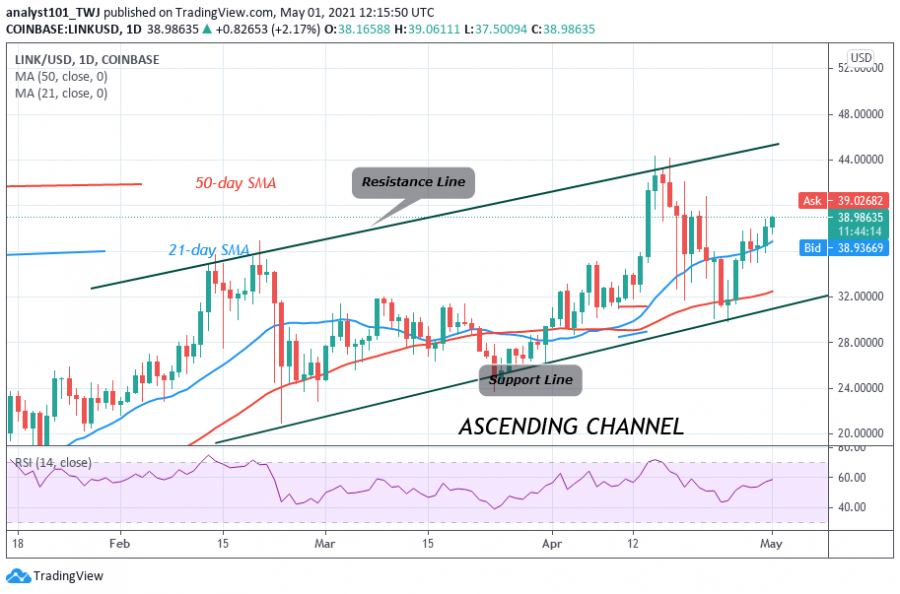
LINK price is in an uptrend and it is attempting to revisit the previous highs of $40 and $44. Yesterday, buyers are finding penetration difficult at the $38 high.
On April 20, buyers could not penetrate this level; the market fluctuated below this level for three days before resuming the downward move. The downtrend extended to the low of $30.11 but the bulls bought the dips. On the upside, if buyers break the initial resistance at $38, the LINK price will retest the previous highs of $40 and $44. Conversely, if Chainlink faces rejection at the recent high, the market will decline to $35 low. LINK/USD is trading at $38.84 at the time of writing.
Chainlink indicator reading
LINK price has broken above the 21-day SMA and 50-day SMA which suggests that the market is likely to rise on the upside. The altcoin is at level 58 of the Relative Strength Index period 14. It indicates that LINK is in the uptrend zone and above the centerline 50. The 21-day SMA and 50-day SMA are sloping upward indicating the uptrend.
Technical indicators:
Major Resistance Levels – $45 and $50
Major Support Levels – $25 and $20
What is the next move for Chainlink?
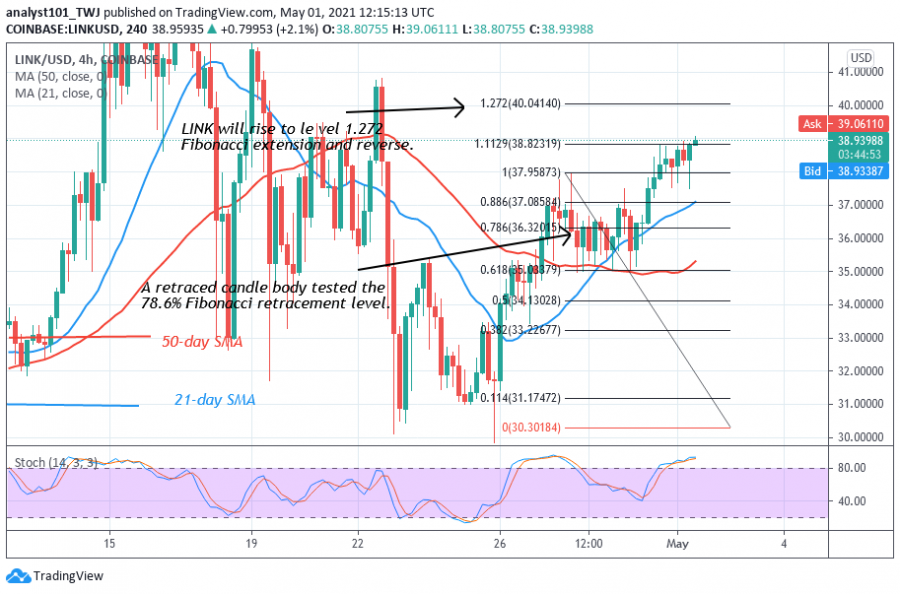
Chainlink’s price is rising on the upside but the uptrend is likely to be short-lived. On April 27 uptrend; a retraced candle body tested the 78.6% Fibonacci retracement level. This retracement implies that the market will rise and reverse at level 1.272 Fibonacci extensions or the high of $40.42. Presently, the altcoin is rising toward the Fibonacci extension level.
Disclaimer. This analysis and forecast are the personal opinions of the author that are not a recommendation to buy or sell cryptocurrency and should not be viewed as an endorsement by Coin Idol. Readers should do their own research before investing funds.