- CHZ has been confined inside a falling wedge pattern on the daily frame
- The price OF CHZ is currently trading at a low of 19% from its 52 week high
- FC Barcelona token powered by CHZ goes live on Binance
On a brief look at the daily time frame, CHZ is wrapped inside a very bullish pattern known as the falling wedge. However, after a strong consolidation period, there was a breakout towards the upside on April 16. It got disrupted because of bitcoin and all other altcoins collapsing. The fakeout was followed by a massive fall where the price action formed a head and shoulder pattern. Despite the market crash, the price of CHZ did not go any lower than $0.34, making it one of the significant support levels. The uptrend got confirmed once we saw a Doji candlestick at this particular support level. After bouncing on that range, the price action went parabolic and surged by 60% in a short span of 4 days. Just when the price was about to approach the breakout of the falling wedge, the uptrend began to subside, and CHZ witnessed a fall of 4.65% today. Nonetheless, the overall structure is extremely bullish, and CHZ could be forming a potential cup and handle pattern.
Source-tradingview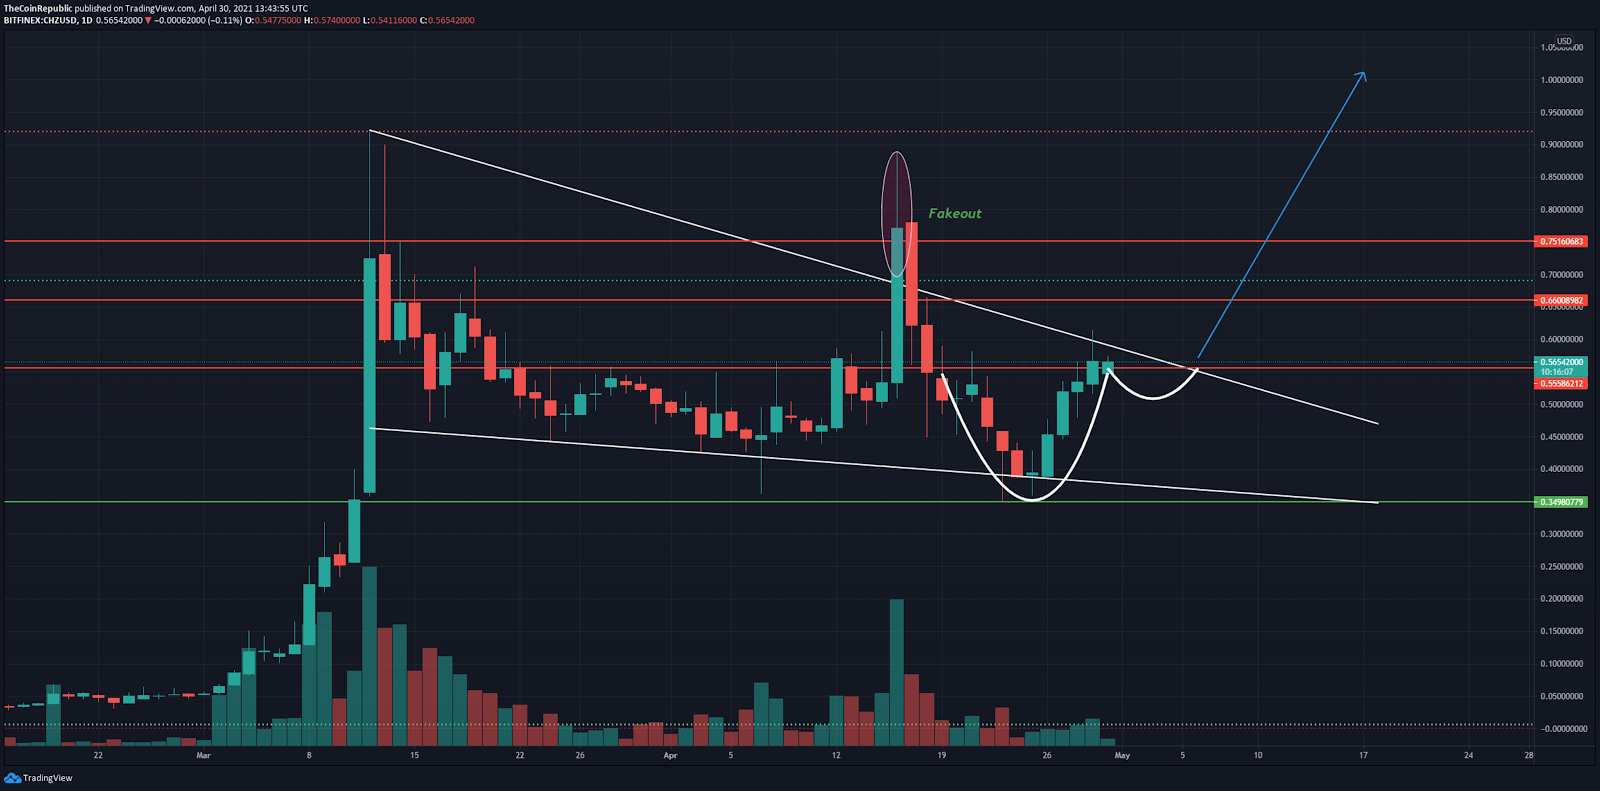
Golden Cross on the 4-hour chart
Source-tradingview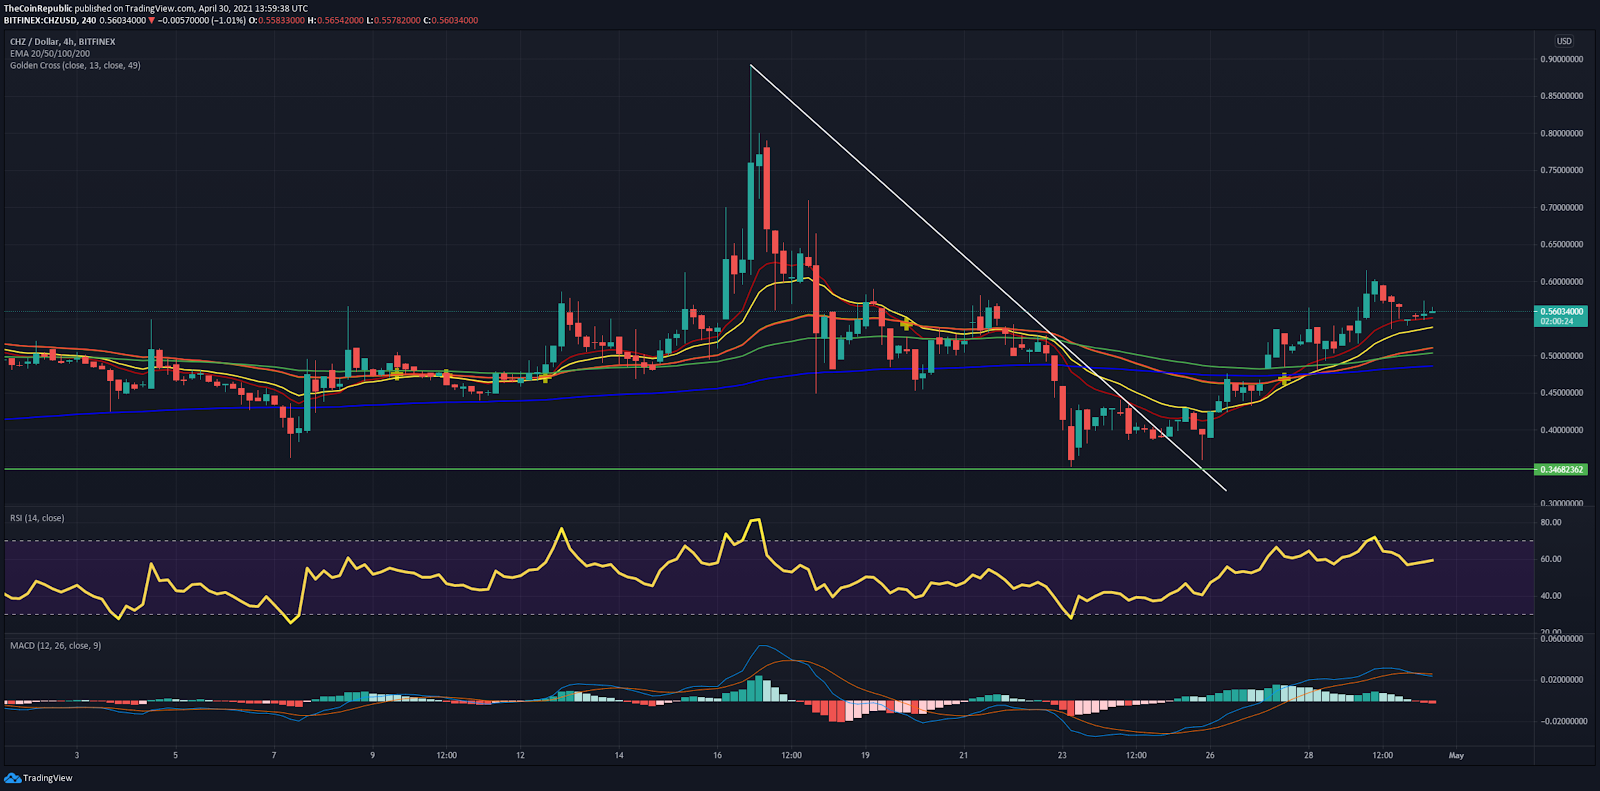
The 4-hour chart depicts a golden crossover detected once the 20 EMA (yellow) went above all the key EMAs. This is by far one of the most bullish reversal patterns. Other than that, CHZ is hanging above all key EMA’s on every time frame. It is expected to act as strong support levels in the near term.
The price of CHZ is currently sitting at the resistance level of $0.56. A decisive close above this level of $0.55 (FIB 0.382) would guarantee a weekly high. CHZ must stay above the level of $0.48 (FIB 0.236) because it can act as a major resistance zone once it’s broken.
The RSI has eventually cooled down after hovering in the overbought territory for hours and, at present, is inside the equilibrium range of 59.
The MACD line has crossed below the signal line indicating a short-term bearish scenario.
CONCLUSION: Even though it may appear that the trend will consolidate or retrace further down, the overall structure of CHZ is extremely bullish. Undoubtedly, the milestone of $1 seems eminent. The token is also about to approach the apex of the wedge pattern. It is likely to skyrocket if the momentum persists. However, bitcoin dominance also plays a significant role, as we saw how the bullish momentum of CHZ got shattered once the market started falling.
SUPPORT : $0.36
RESISTANCE : $0.56 and $0.91