As Bitcoin price crashed below $50,000, mainstream media highlighted that the selling across the market could have been triggered by reports that the Biden administration proposed increasing the capital gains tax to 39.6% from the current 20% for people earning more than $1 million a year.
In other news, there was an apparent exit scam carried out by Thodex exchange owner Faruk Fatih Özer, which has affected about 391,000 users of the Turkish crypto exchange. Rumors are afloat that the owner may have fled the country with nearly $2 billion worth of crypto assets.
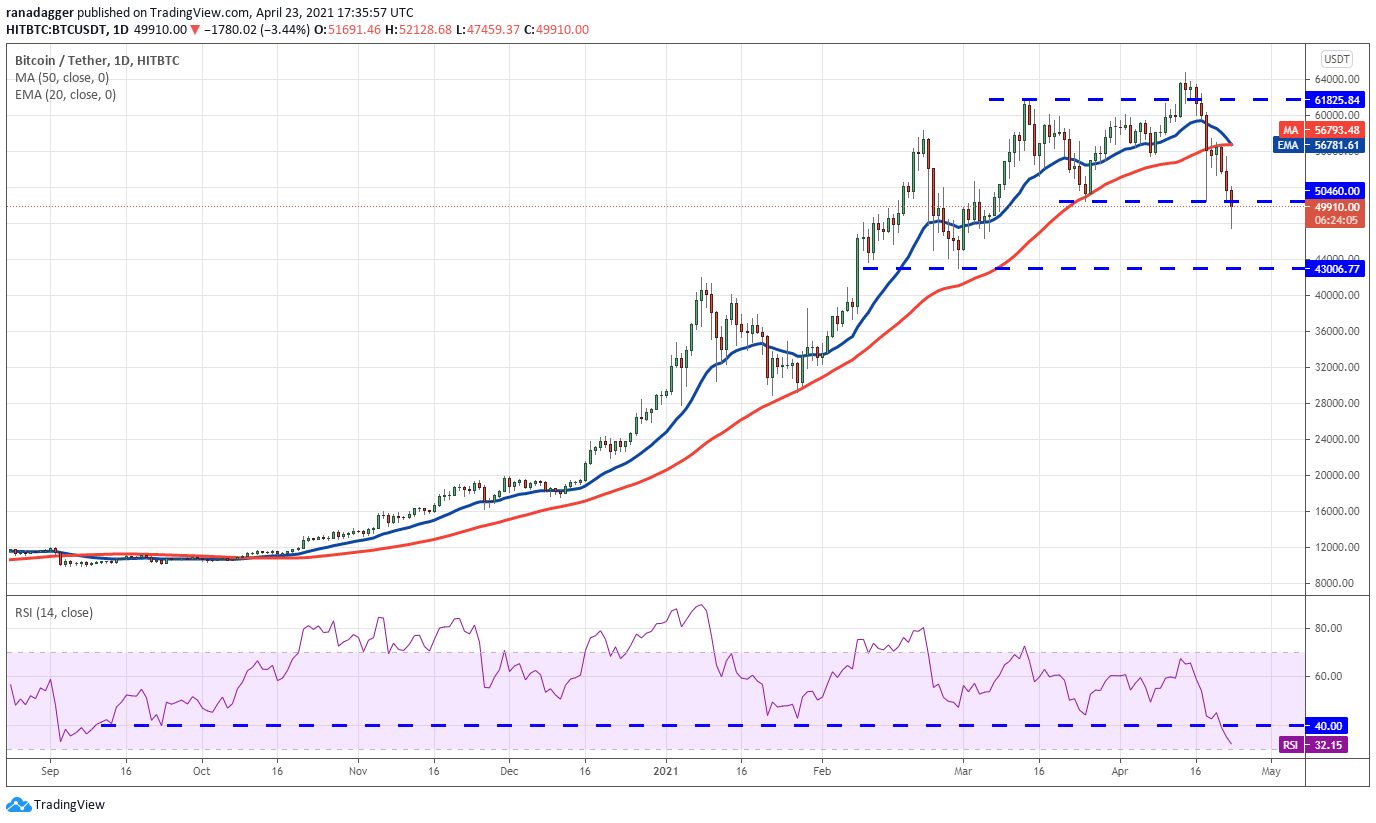
The moving averages have completed a bearish crossover and the relative strength index (RSI) is near the oversold level, indicating a possible change in sentiment. This is the first time the RSI has plunged below 40 since the start of the bull trend in October of 2020.
If the bears can sustain the price below $50,460, the BTC/USDT pair could continue to slump towards the next critical level at $43,006.77 where buyers are likely to step in aggressively. The extent of the rebound from this level will give better insight into whether the correction has ended or not.
This negative view will invalidate if the price rebounds off the current level and rises above the moving averages. The next leg of the uptrend could start after the bulls push the price above $64,849.27.
ETH/USDT
Ether (ETH) broke above $2,545.84 on April 22 and hit a new all-time high at $2,645. However, the long wick on the daily candlestick shows that the bulls could now sustain the breakout. This may have trapped aggressive breakout traders, who might have been stopped out of their positions today.
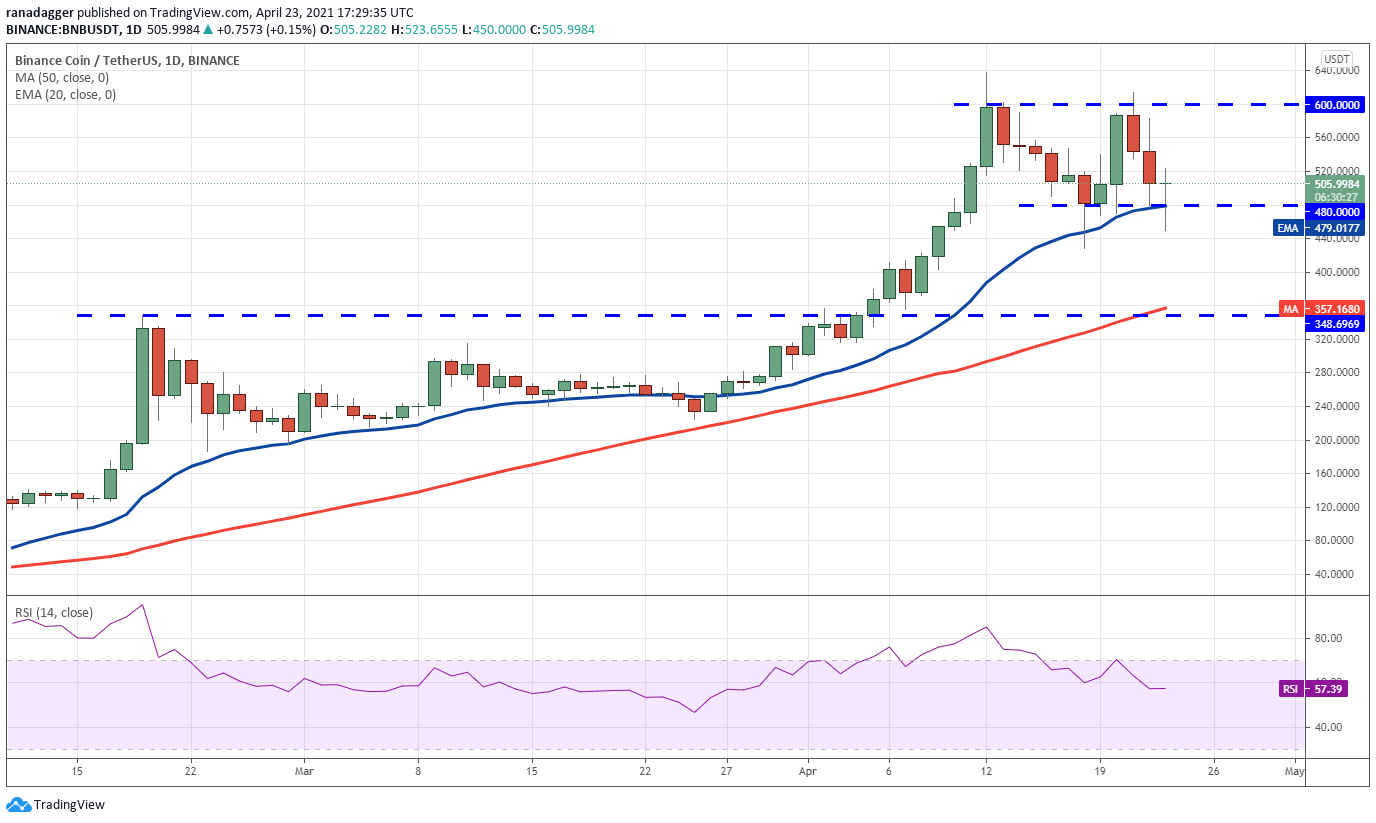
The long tail on today’s candlestick suggests the bulls continue to buy the dips to the 20-day EMA. The buyers will now again try to push the price to $600 and challenge the overhead resistance zone.
If they can thrust the price above $638.56, the BNB/USDT pair may start the next leg of the uptrend, which could reach $832.
However, if the price turns down from the overhead resistance zone, the pair could remain range-bound for a few days. The first sign of weakness will be if the price dips and sustains below the 20-day EMA. Such a move could result in a drop to the 50-day SMA ($357).
XRP/USDT
The failure of the bulls to build upon the rebound off the 20-day EMA ($1.22) on April 21 shows a lack of buyers at higher levels. The bears pounced on this opportunity and broke the 20-day EMA today, pulling XRP to the 78.6% Fibonacci retracement level at $0.86.
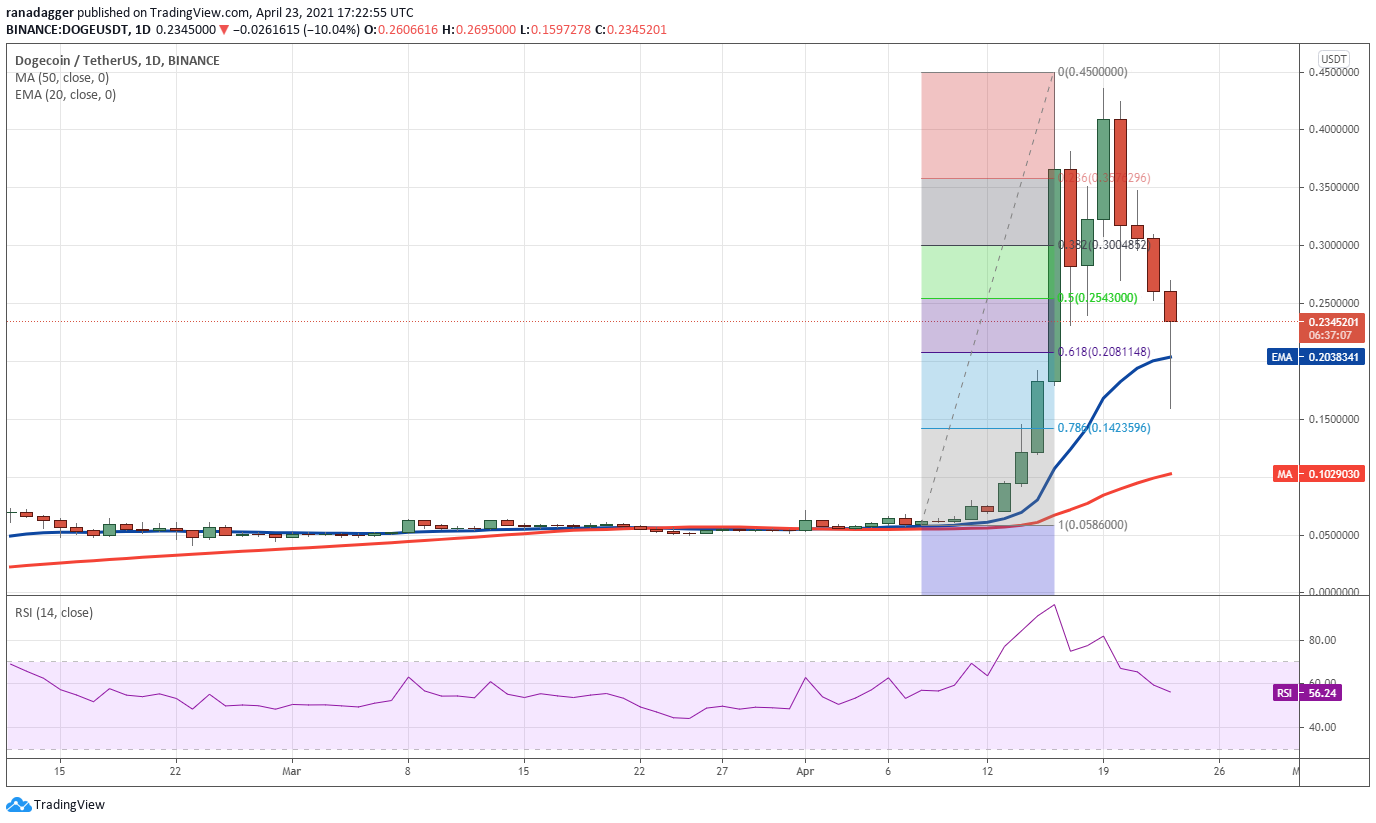
Traders purchased at lower levels today and the DOGE/USDT pair has risen above the 20-day EMA. If the bulls sustain the price above the 20-day EMA, the pair may attempt to rise to $0.35.
However, the flat 20-day EMA and the RSI below 57 indicate the bulls have lost their advantage. If the pair loses ground and closes below the 20-day EMA, the selling could intensify further and a drop to the 50-day SMA ($0.10) is possible.
ADA/USDT
Cardano (ADA) turned down from the 20-day EMA ($1.24) on April 21, suggesting the sentiment has turned negative and traders are selling on rallies. The bears broke the $1.03 support today but have not been able to sustain the lower levels.
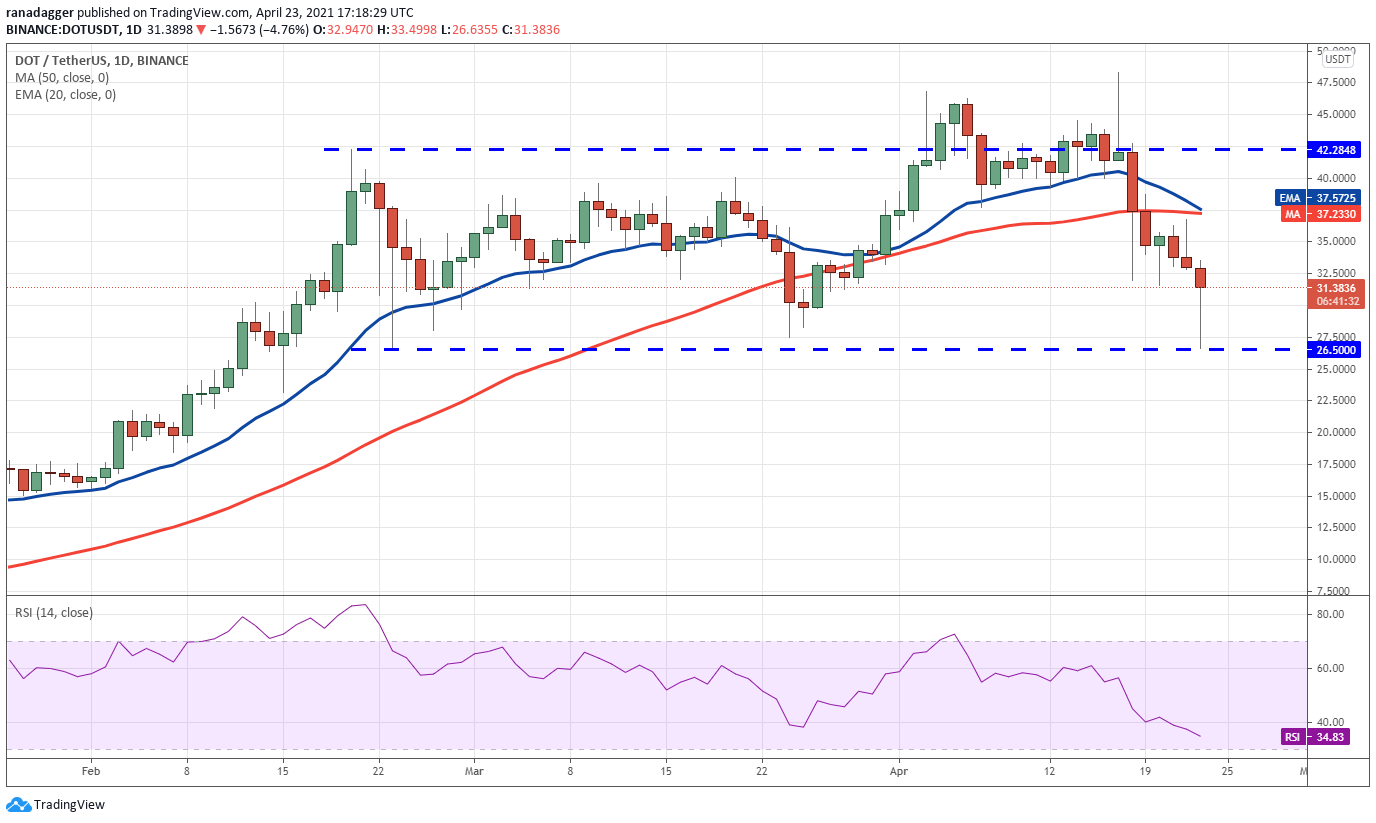
The selling picked up momentum today and the DOT/USDT pair dropped to the $26.50 support. However, the sharp bounce off this support suggests the bulls are defending this level aggressively.
If the bulls sustain the recovery, the pair could remain range-bound for a few more days. A breakout of the moving averages will be the first sign of strength while a break below $26.50 will signal the possible start of a new downtrend.
UNI/USDT
Uniswap (UNI) rose above the $35.20 overhead resistance on April 21 and again on April 22. However, on both occasions, the altcoin met with stiff resistance at higher levels as seen from the long wick on the day’s candlestick.
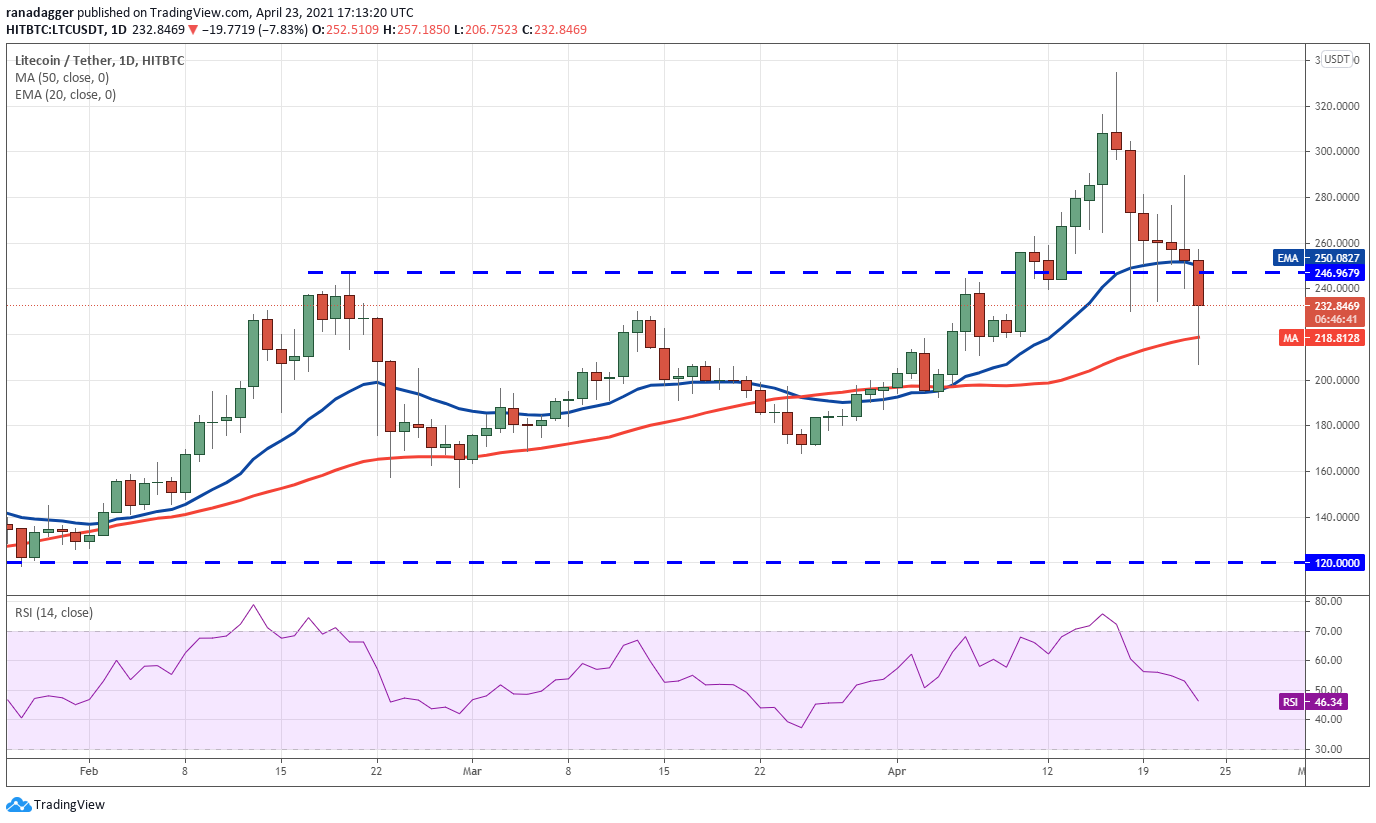
The long tail on today’s candlestick suggests the bulls are buying at lower levels and trying to stage a recovery. However, they are likely to face stiff resistance near the 20-day EMA ($250.)
If the price turns down from the 20-day EMA, it will suggest that the sentiment has turned negative and traders are selling on rallies. That will increase the possibility of a break below the 50-day SMA. If that happens, the LTC/USDT pair could plunge to $168.
This negative view will invalidate if the price turns up from the current level and rises above $246.96.
BCH/USDT
The relief rally in Bitcoin Cash (BCH) reversed direction from $998.49 on April 21 and the selling intensified today when the bears broke the 20-day EMA ($797) support. However, the bulls are attempting to stage a recovery from the intraday lows as seen from the long tail on the candlestick.
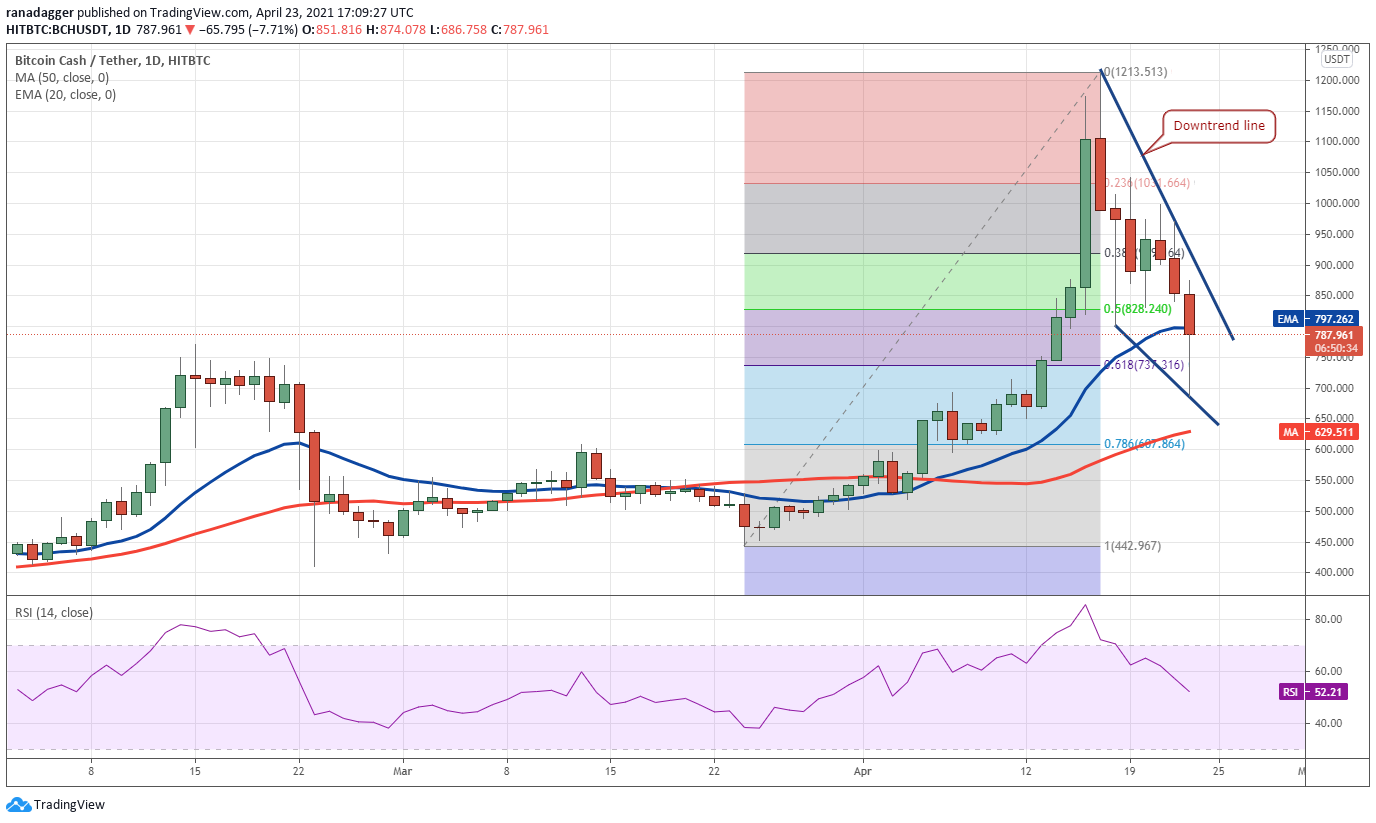
If the BCH/USDT pair sustains the recovery, it will suggest buying at lower levels. The bulls will then try to push the price above the downtrend line. If they succeed, the pair could again rise to $1,000 where the bears will mount stiff resistance.
The flat 20-day EMA and the RSI near the midpoint suggest the bulls have lost their advantage. If the price turns down from the downtrend line, the bears will make one more attempt to sink the price to the 50-day SMA ($629).
Such a deep fall is likely to delay the next leg of the uptrend and keep the pair range-bound for a few days.
The views and opinions expressed here are solely those of the author and do not necessarily reflect the views of Cointelegraph. Every investment and trading move involves risk. You should conduct your own research when making a decision.
Market data is provided by HitBTC exchange.