A lot of hype was built up before the Coinbase listing on the Nasdaq on April 14 and several cryptocurrencies rallied in the run-up to the event.
However, traders usually buy the rumor and sell the news. In this case, they bought until the event, and then several investors seem to have booked profits aggressively. This resulted in a correction in several major cryptocurrencies, including Bitcoin (BTC).
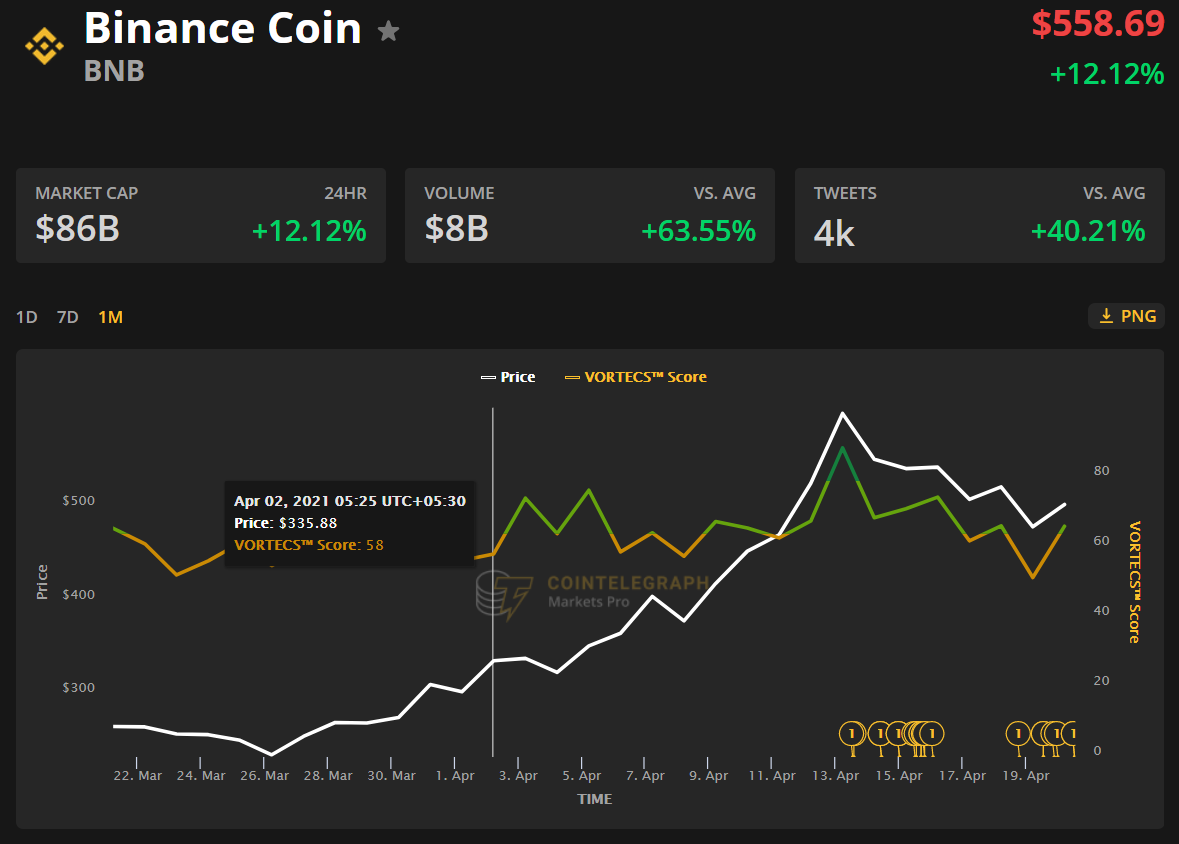
As seen from the one-month chart above, the VORTECS™ Score for BNB flipped green on April 2 when the price was close to $335.
Barring small periods, the VORTECS™ Score remained in the green all through the rally to $601 on April 13. Thus the indicator could have assisted traders in sticking with the rally even while other analytical methods may have warned of overbought levels.
The coin witnessed profit booking above $600 and corrected to the 20-day exponential moving average ($463) on April 18. However, a positive sign is that the bulls did not allow the price to hang below the 20-day EMA.
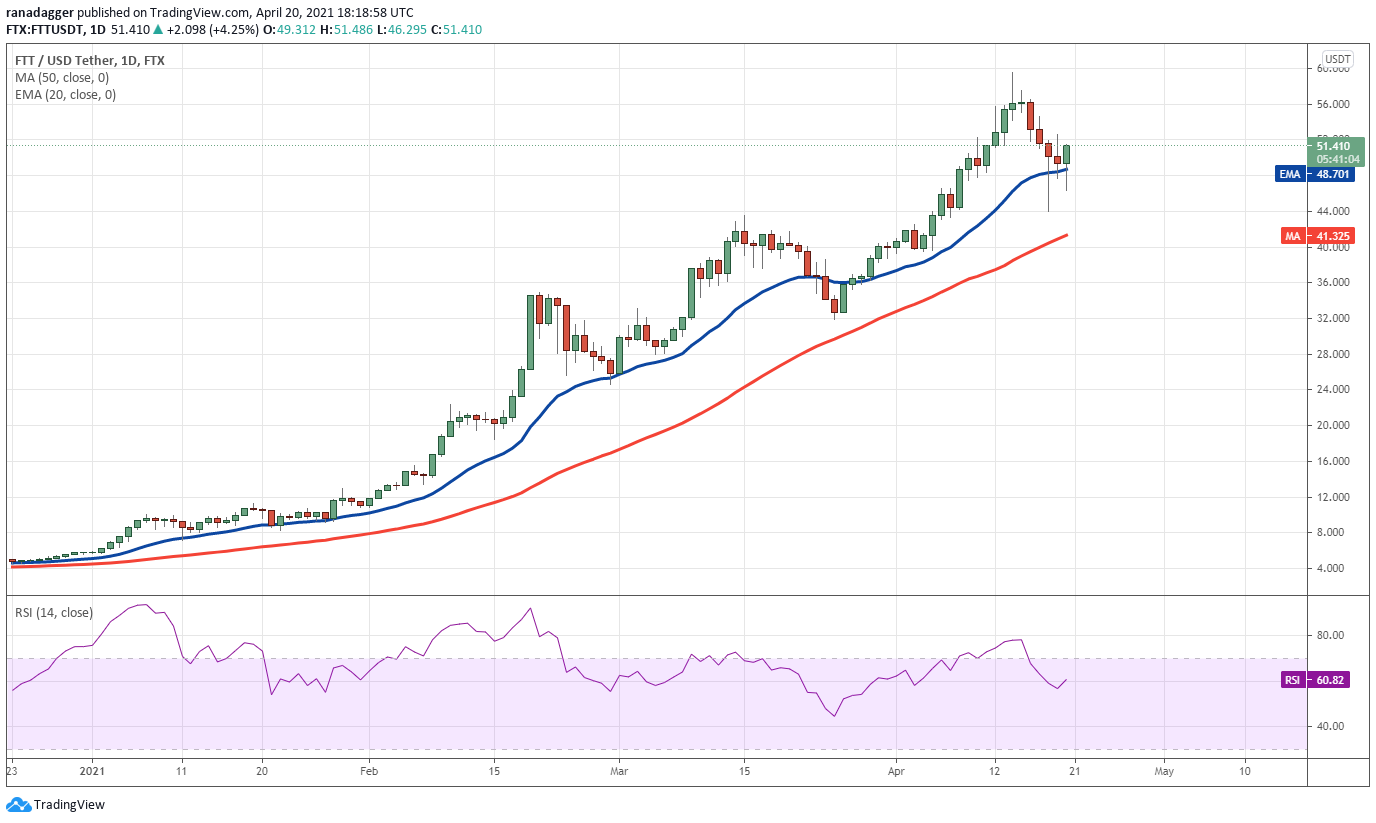
If the bulls can push the price above $52.55, the FTT/USDT pair could rally to $59.59. If the bulls can thrust the price above this resistance, the momentum is likely to pick up and the pair could rally to $71.89.
However, if the bulls fail to propel the price above $52.55, it will suggest that demand dries up at higher levels. That could strengthen the bears and they will then try to sink the price to the 50-day simple moving average ($41.32).
This is an important support to watch out for because the price has not closed below it since mid-November of last year. Therefore, a break below it will suggest a change in trend and open the gates for a deeper correction to $32.
HT/USDT
Huobi Token (HT) was trading at $18.94 on Feb. 19 and from there it moved up to an all-time high at $26.89 on Feb. 20, but since then, it has not been able to come close to the level.
The token witnessed a sharp correction after hitting the all-time high and it dropped to an intraday low at $12.13 on March 25, losing about 55% from the highs.
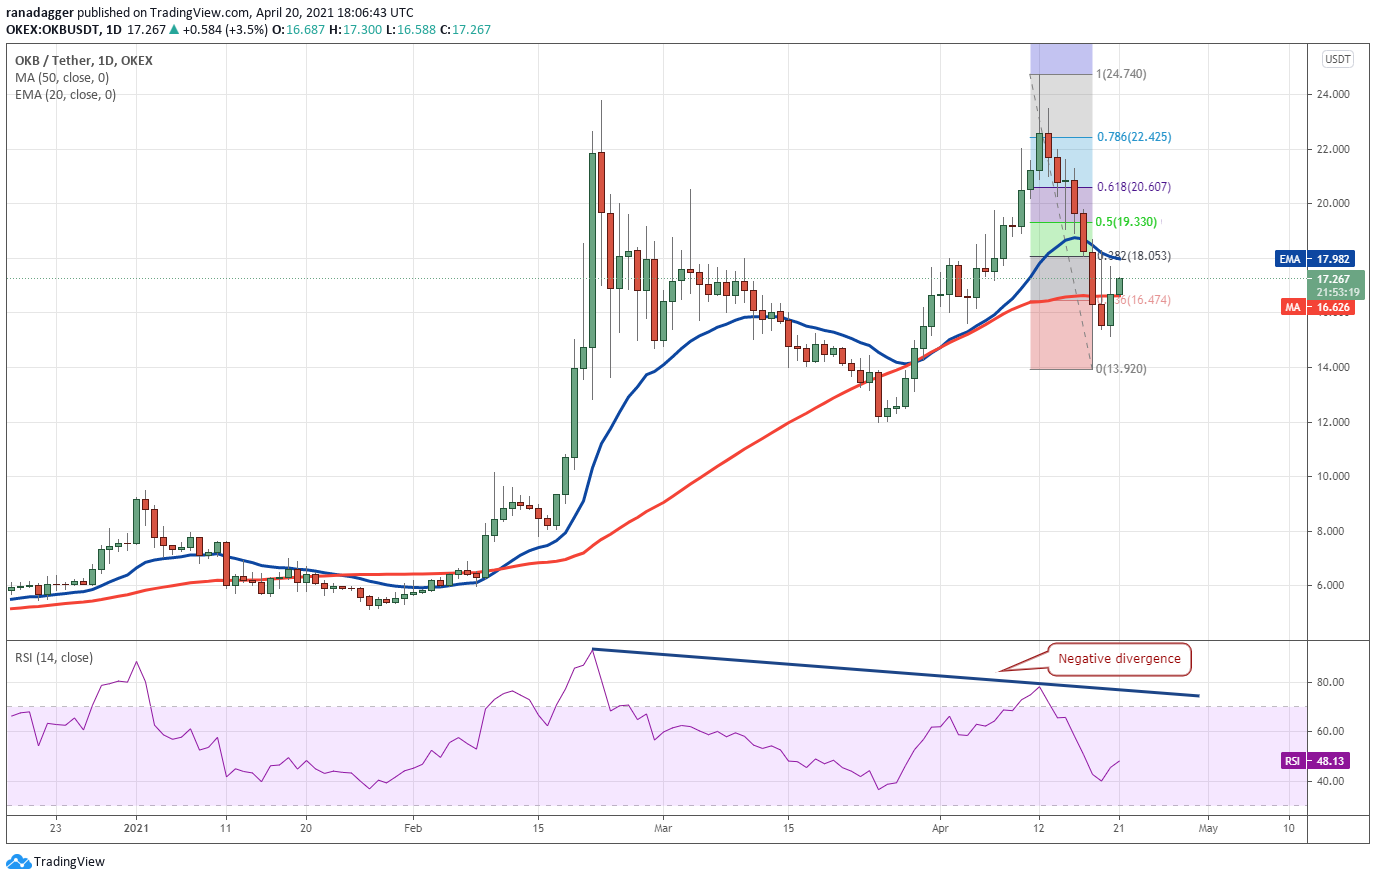
Although the bulls cleared the $23.80 hurdle on April 12, they could not sustain the higher levels. The OKB/USDT pair again witnessed a sharp decline and hit an intraday low at $13.92 on April 18.
The bulls are currently attempting to start a relief rally but have hit a wall at the 20-day EMA ($17.98). This suggests the sentiment has turned negative and traders are selling on rallies. If the price turns down and breaks below $14, the pair could drop to $12.
A break below this level could intensify the selling and the pair could drop to $8. The 20-day EMA has started to turn down and the RSI is just below the midpoint, suggesting a slight advantage to the bears.
This negative view will invalidate if the bulls push and sustain the price above the 20-day EMA. Above this resistance, the pair could move up to the 61.8% Fibonacci retracement level at $20.60. This level is again likely to act as stiff resistance but if it is scaled the pair could retest $24.74.
The views and opinions expressed here are solely those of the author and do not necessarily reflect the views of Cointelegraph. Every investment and trading move involves risk, you should conduct your own research when making a decision.