ADA/USD – Bulls Continue To Defend April Support At $1.15
Key Support Levels: $1.15, $1.07, $1.00.
Key Resistance Levels: $1.25, $1.38, $1.48.
Cardano has been holding the support at $1.15 for the past fortnight of trading. Before this, it rebounded from a rising trend line at around $1.05 as it started to push higher to break above the current $1.15 support.
This week, ADA did manage to push upward as it reached as high as $1.35. However, the cryptocurrency could not sustain these highs and failed to close a daily candle above $1.25. From there, it dropped yesterday to return to the $1.15 support.
ADA-USD Short Term Price Prediction
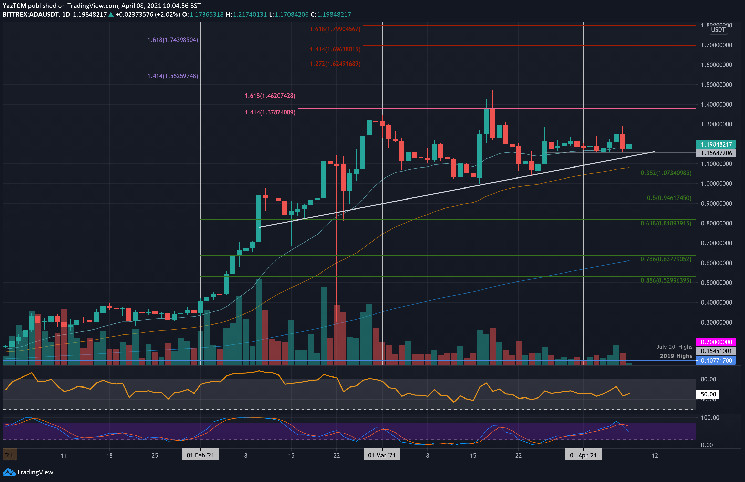
Looking ahead, the first level of resistance lies at $1.25. This is followed by $1.38 (1.414 Fib Extension (1.414 Fib Extension & March resistance), $1.48 (ATH price), and $1.56 (1.414 Fib Extension – purple). Additional resistance lies at $1.625 (1.272 Fib Extension) and $1.69 (1.414 Fib Extension – red).
On the other side, the first support lies at $1.15. This is followed by the rising trend line, $1.07 (.382 Fib & 50-day EMA), $1.00, and $0.946 (.5 Fib).
The RSI is still sitting along the midline and has been here for the past fortnight. This indicates indecision within the market as the participants cannot decide which direction to head toward next. For a push toward the March highs, the RSI must start to rise to indicate bullish strength within the market.
ADA/BTC – Consolidation Pattern Approaches Apex
Key Support Levels: 2100 SAT, 2000 SAT, 1800 SAT.
Key Resistance Levels: 2295 SAT, 2455 SAT, 2645 SAT.
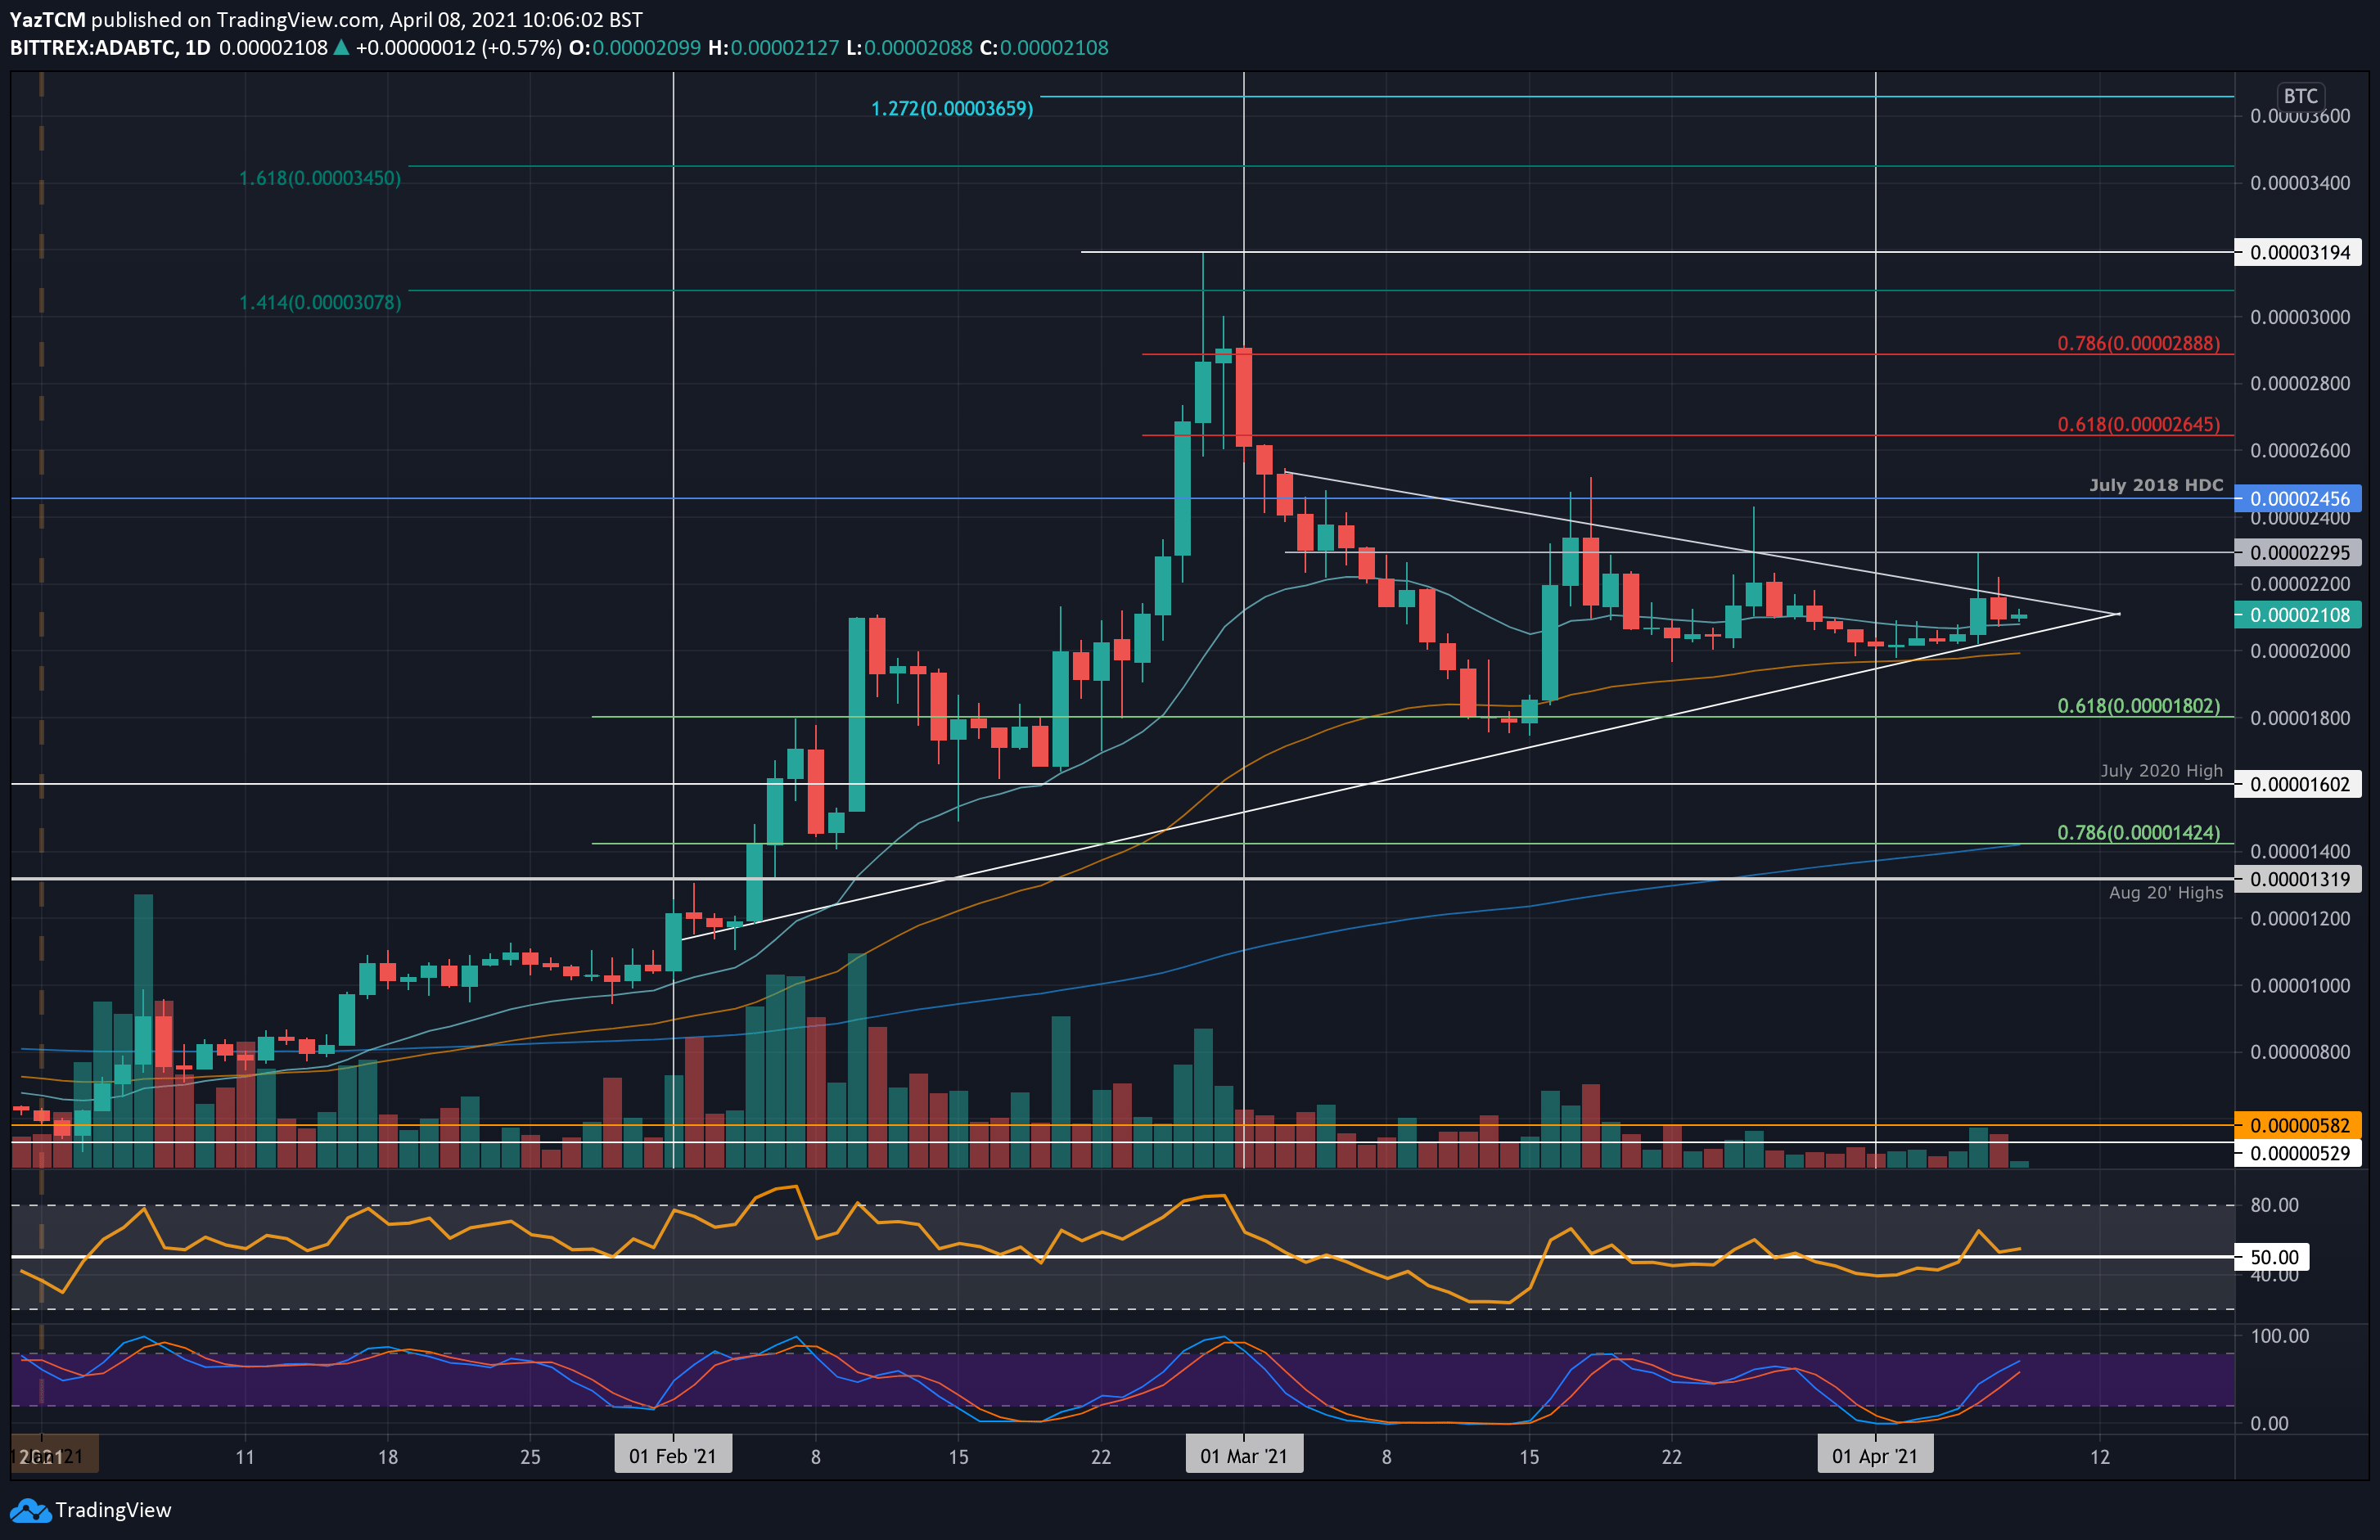
Against Bitcoin, ADA continues to trade inside a symmetrical triangle pattern that was established during March. The coin has remained above the 2000 SAT support during April and recently managed to surge as high as 2295 SAT. However, it could not close a daily candle above the triangle’s upper angle and has since returned to the 20-day EMA at around 2100 SAT.
The coin approaches the triangle’s apex, where the market can still expect a breakout in either direction. The breakout direction of the triangle will dictate the next trend for ADA.
ADA-BTC Short Term Price Prediction
Looking ahead, if the bulls break the upper boundary of the triangle, the first level of resistance lies at 2295 SAT. This is followed by 2455 SAT (July 2018 High-Day close), 2645 SAT (bearish .618 Fib), and 2800 SAT.
On the other side, the first support lies at 2100 SAT (20-day EMA). Beneath this, support lies at the lower boundary of the triangle, 2000 SAT (50-day EMA), 1800 SAT (.618 Fib), and 1600 SAT (July 2020 High).
The RSI is also trading near the midline but is slightly above the level. This indicates weak bullish momentum within the market. If the RSI can begin to rise, the increased bullish momentum should allow the coin to break above the triangle.