Elrond (EGLD) has broken out from a descending resistance line and moves towards the closest resistance at $169.
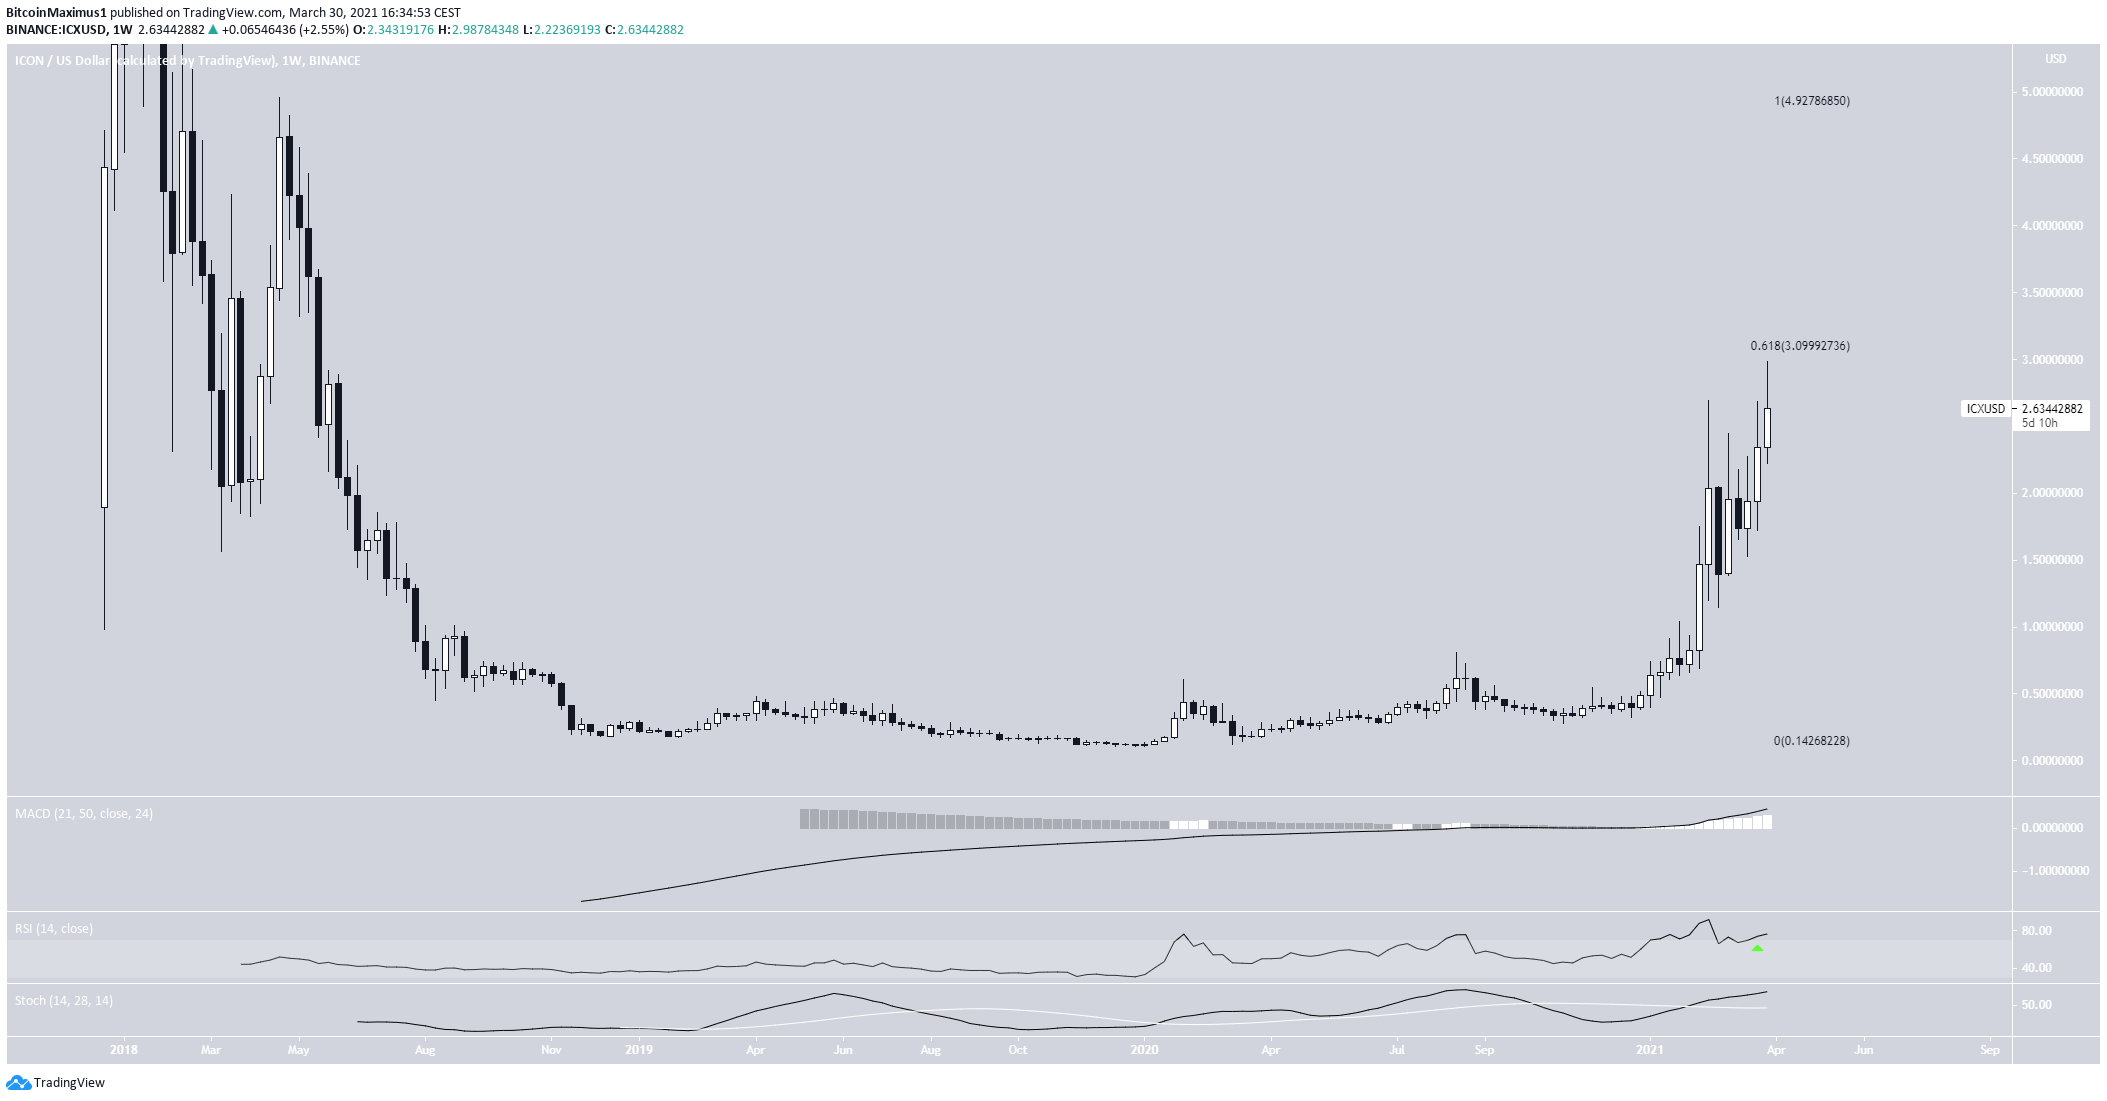
Icon (ICX) has broken out from a symmetrical triangle. It is expected to continue increasing at least until it reaches $3.30.
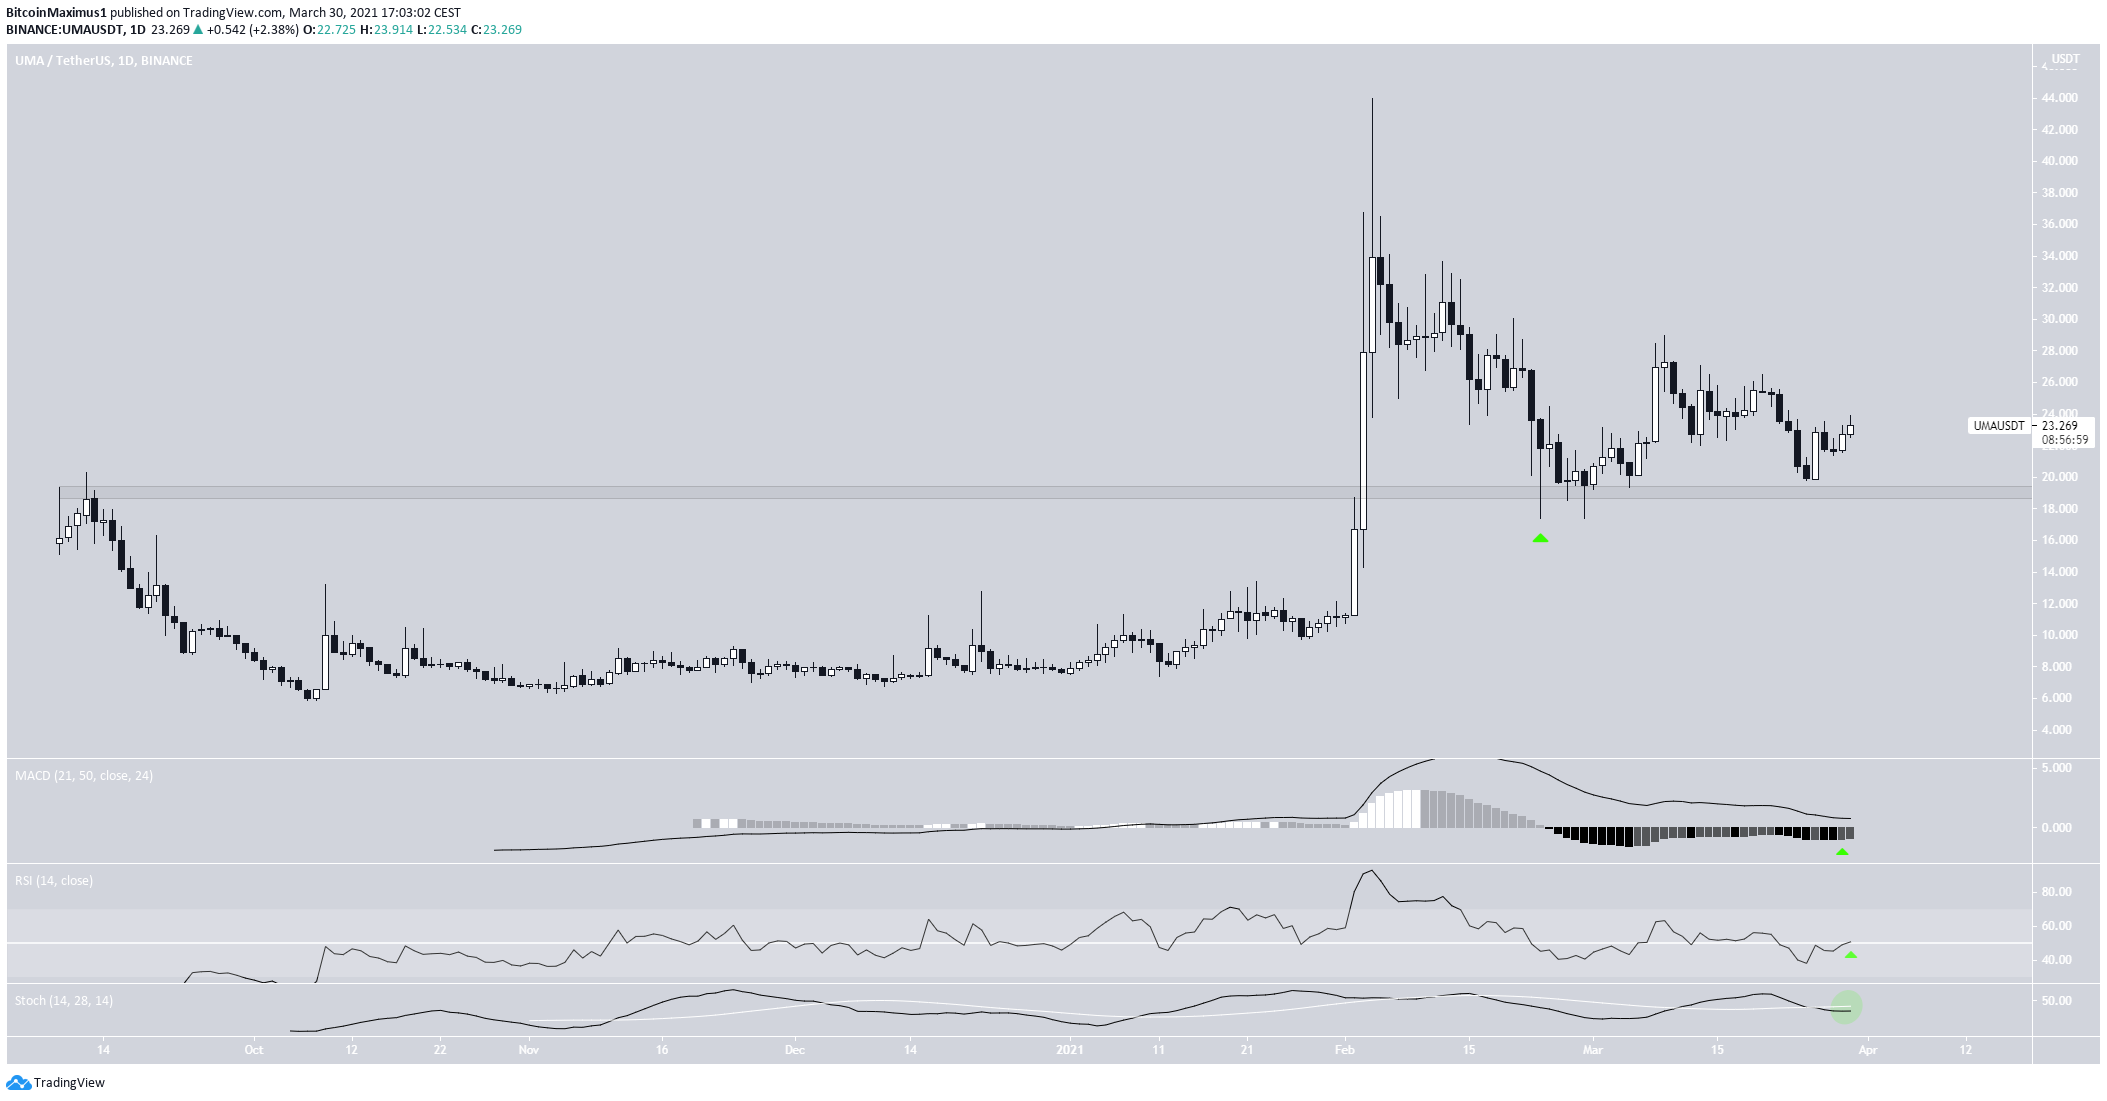
UMA (UMA) has bounced at a long-term support level. However, it has yet to break out from a short-term descending resistance line.
Icon (ICX)
On Feb. 29, ICX reached a high of $2.69 before decreasing. It failed to break out above the February high until exactly one month later, on March 29.
So far, it has managed to reach a high of $2.88 before decreasing slightly.
The main resistance area is $3.10, being the 0.618 Fib retracement of the previous downward movement. If successful in breaking out, ICX could increase all the way to $4.92.
Technical indicators in the weekly time-frame are bullish. Both the MACD & Stochastic Oscillator are increasing.
While the RSI has generated a potential bearish divergence, it has just crossed above 70.
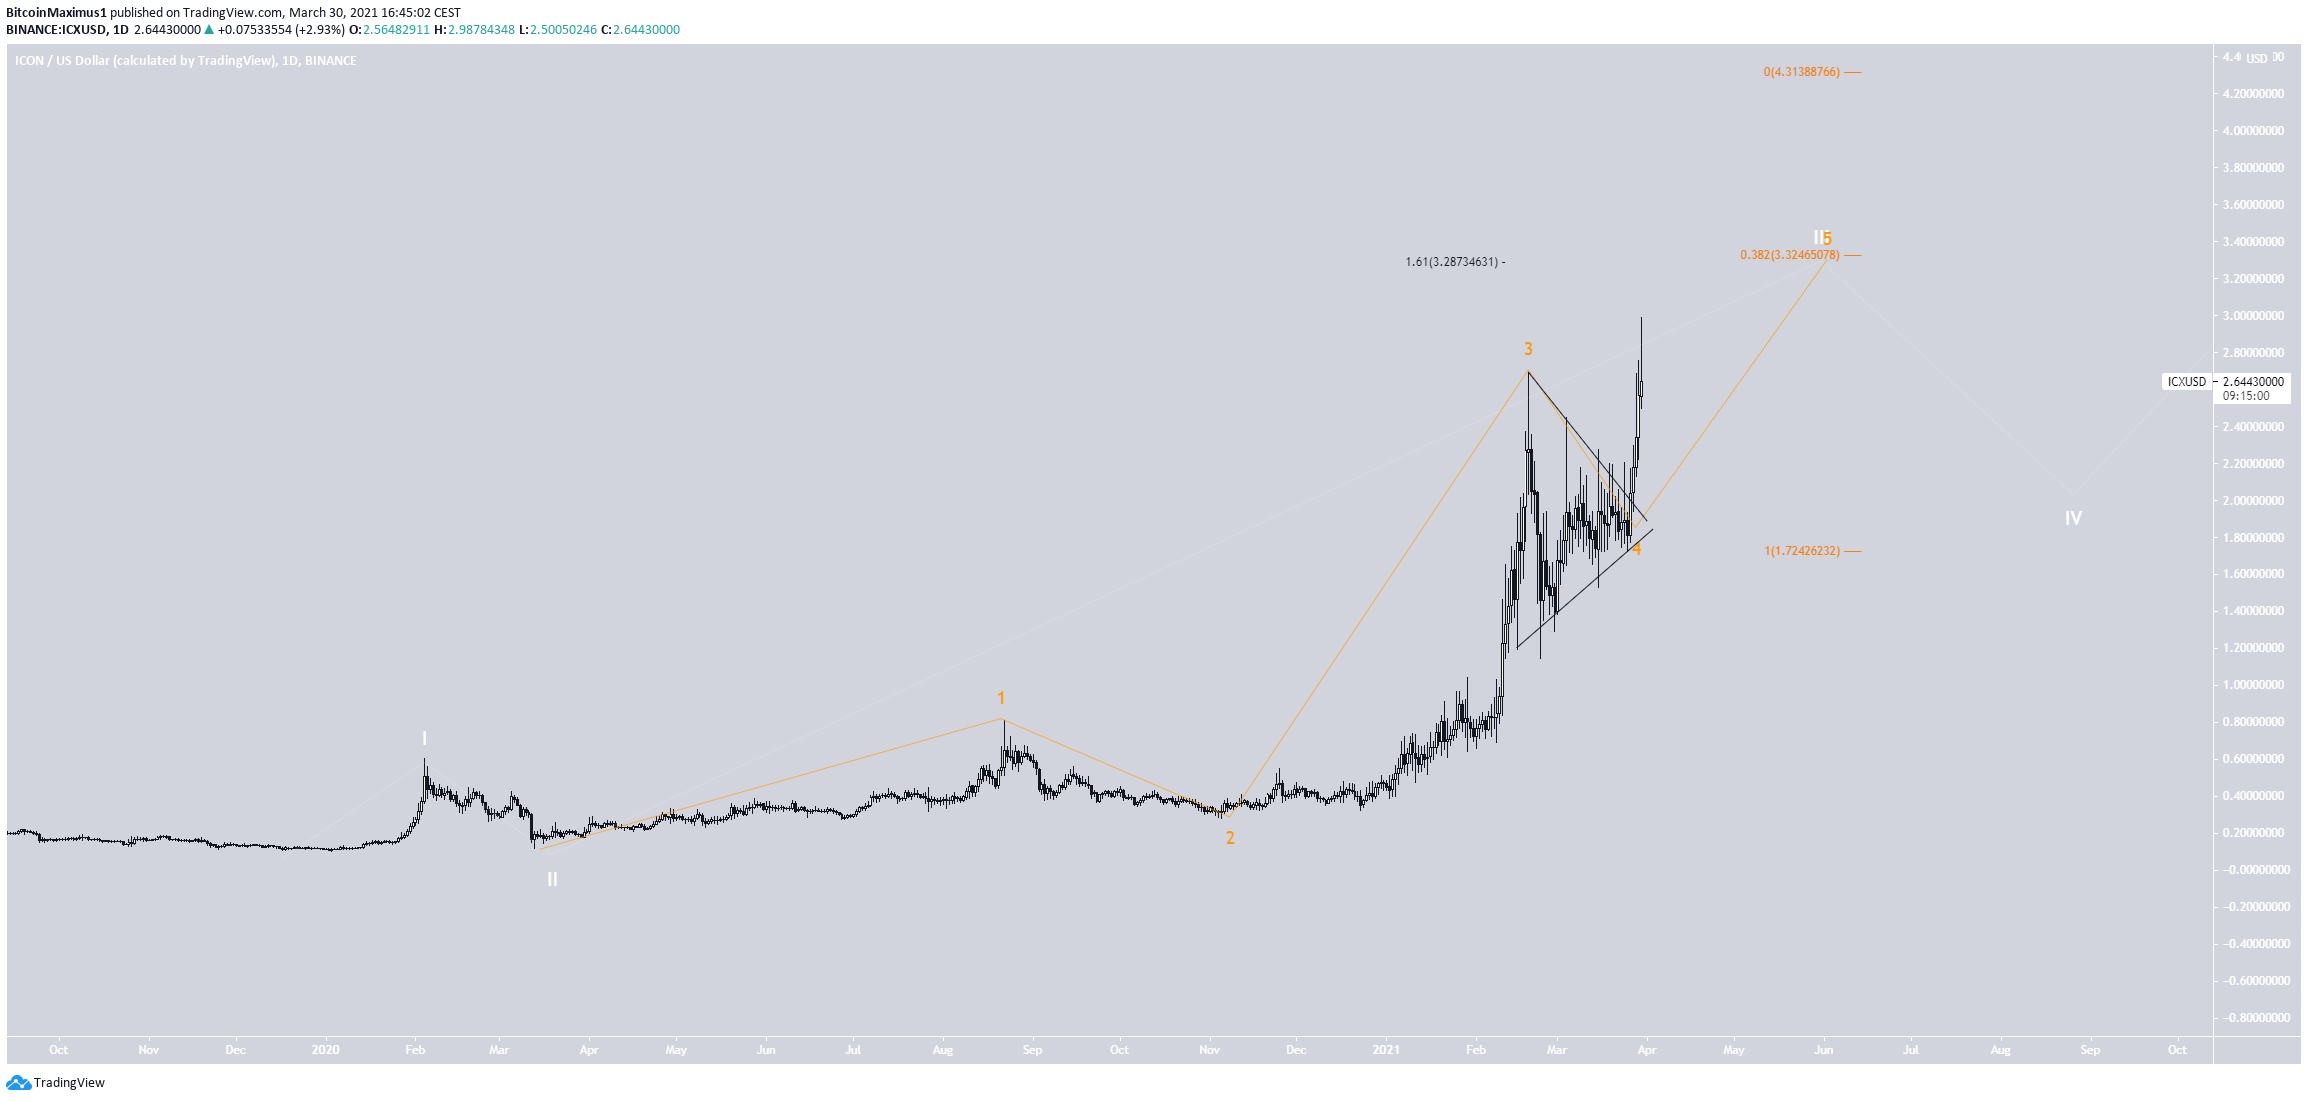
The wave count suggests that ICX is in sub-wave five (orange) of wave three (white).
A potential target for the top of this move is found at $4.30. The target is found using an external retracement (black) on sub-wave four and a Fib projection on waves 1-3.
After $3.30, the next potential target would be found at $4.30.
Highlights
- ICX is facing long-term resistance at $3.10.
- It has broken out from a symmetrical triangle.
Elrond (EGLD)
EGLD has been decreasing since Feb. 9, when it reached an all-time high price of $216.99. Since then, it has been following a descending resistance line.
On March 26, it managed to break out above this line.
Technical indicators in the daily time-frame are bullish.
There is a hidden bullish divergence in the MACD, RSI & Stochastic oscillator. Furthermore, the MACD has given a bullish reversal signal, and the RSI has crossed above 50.
Therefore, EGLD is expected to increase at least towards $169 and possibly higher.
Highlights
- EGLD has broken out from a descending resistance line.
- There is resistance at $169.
UMA (UMA)
UMA has been increasing since bouncing at the $19 support area on Feb. 23. After reaching a high of $28.95 on March 9, UMA returned to validate the $19 support area once more. Since then, it has already created a higher low.
Technical indicators are turning bullish. The MACD has nearly given a bullish reversal signal, and the RSI is close to moving above 50. Similarly, the Stochastic oscillator has nearly made a bullish cross.
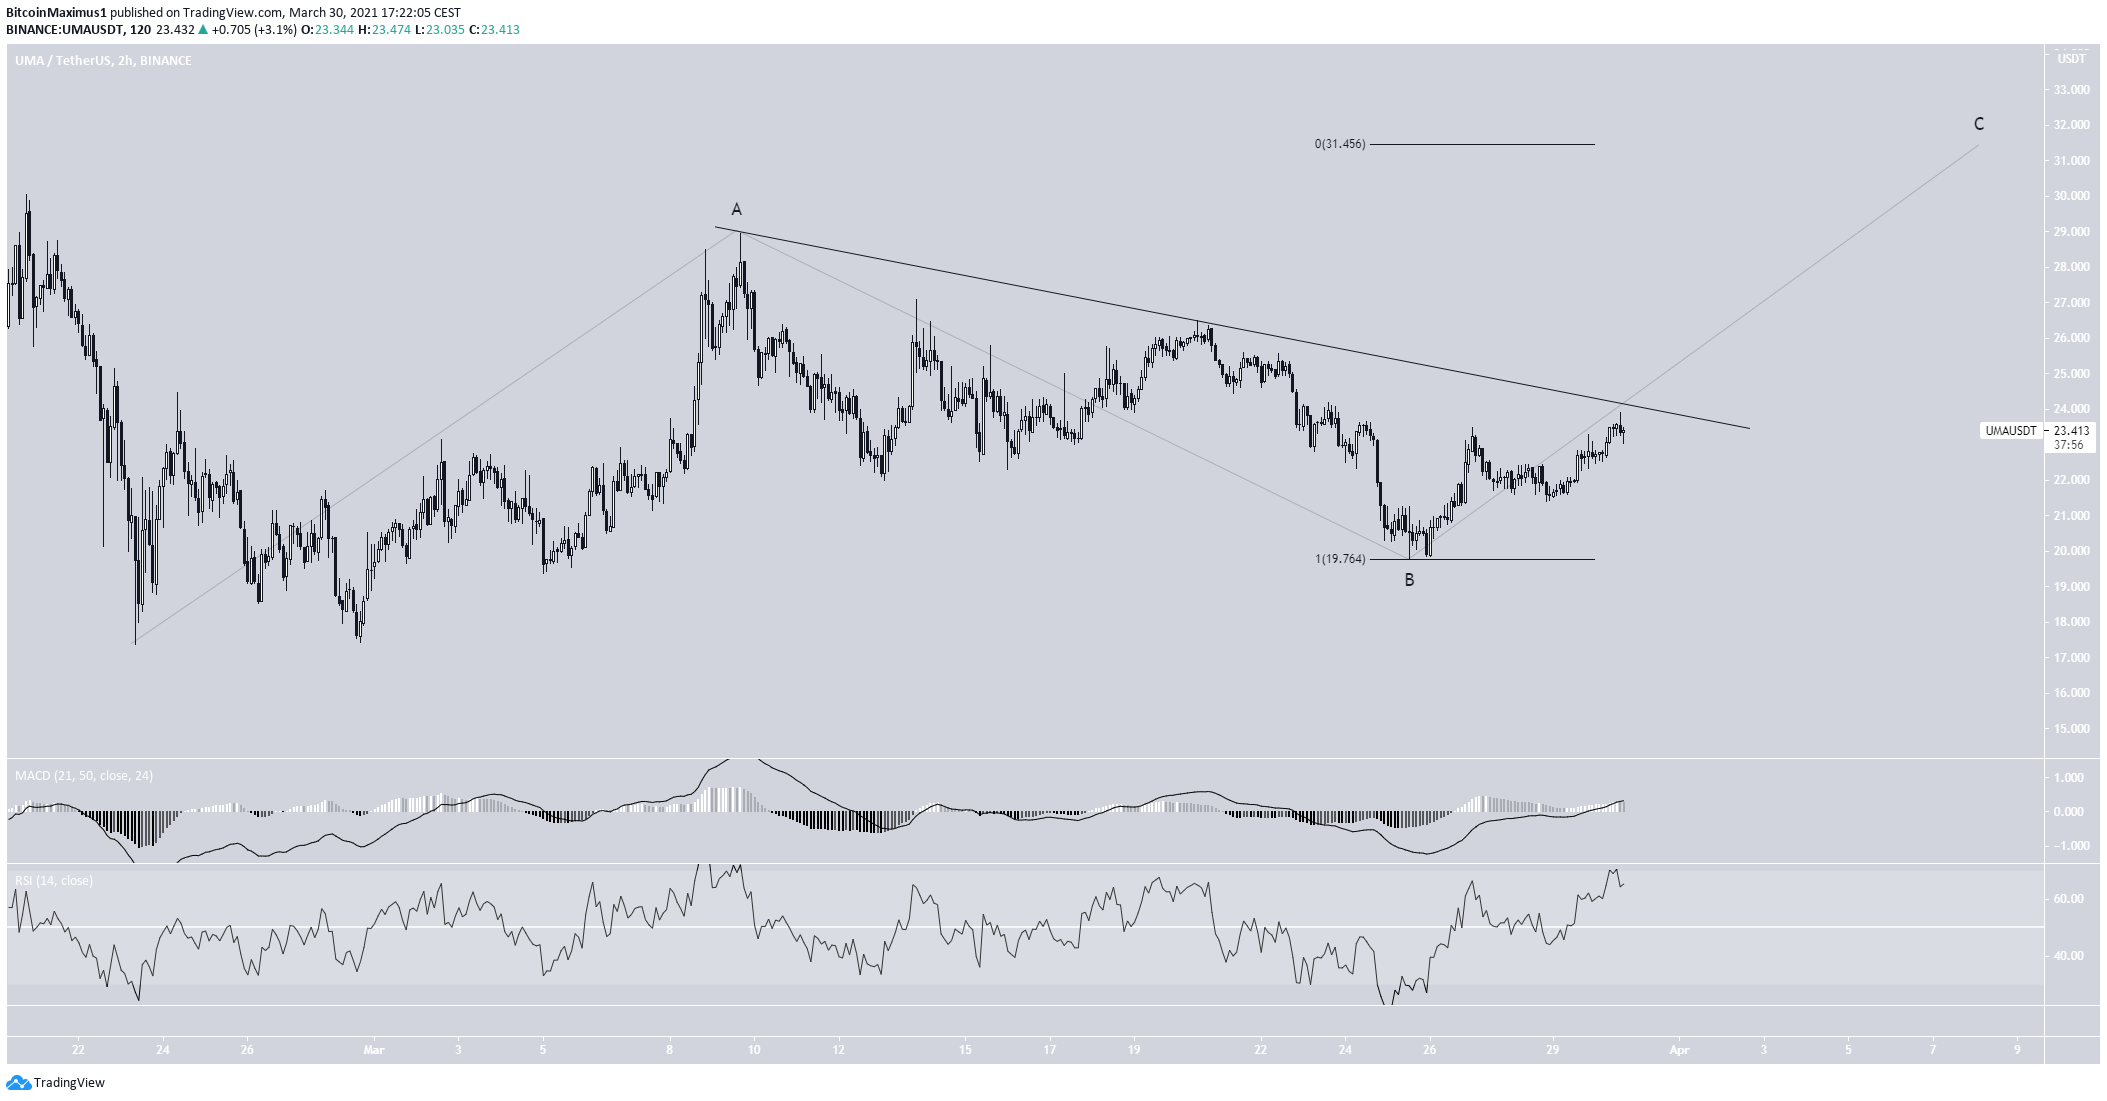
However, the shorter-term two-hour chart shows that UMA has yet to break out from a descending resistance line.
Nevertheless, the movement looks like a flat correction. If so, UMA would be expected to break out and increase towards $31.45. The two-hour MACD & RSI support the possibility of a breakout.
Highlights
- UMA has bounced at the $19 support area.
- It is following a short-term descending resistance line.