The Enjin Coin (ENJ) price has reclaimed the $0.14 support area after falsely breaking down from it. ENJ should increase towards the resistance areas outlined in this article.
Deviation Leads to Reclaim
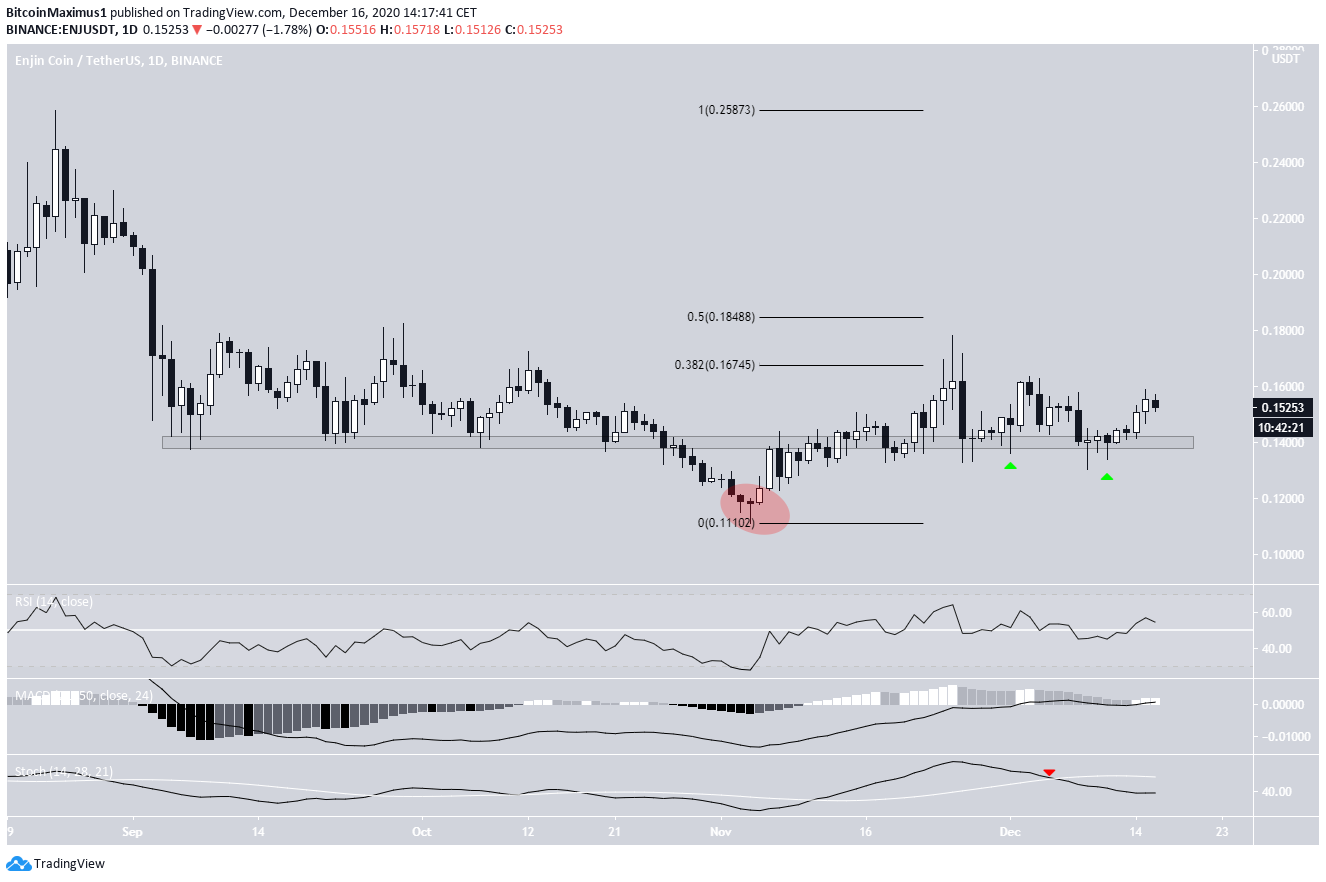
ENJ has been moving downwards since reaching a high of $0.258 on Aug. 24. The downward move continued until it reached a low of $0.11 on Nov. 4.
The low seems to have caused a breakdown (shown with the red circle below) from the $0.14 support area, which had previously been in place since the beginning of Sept.
However, ENJ reclaimed the support area shortly afterward and validated it as support again.
The main resistance area is between $0.167 and $0.184, the 0.382 – 0.5 Fib retracement level of the entire downward move.
Technical indicators are neutral but slightly leaning bullish. The RSI has moved above 50, and the MACD is increasing. On the other hand, the Stochastic Oscillator has made a bearish cross.
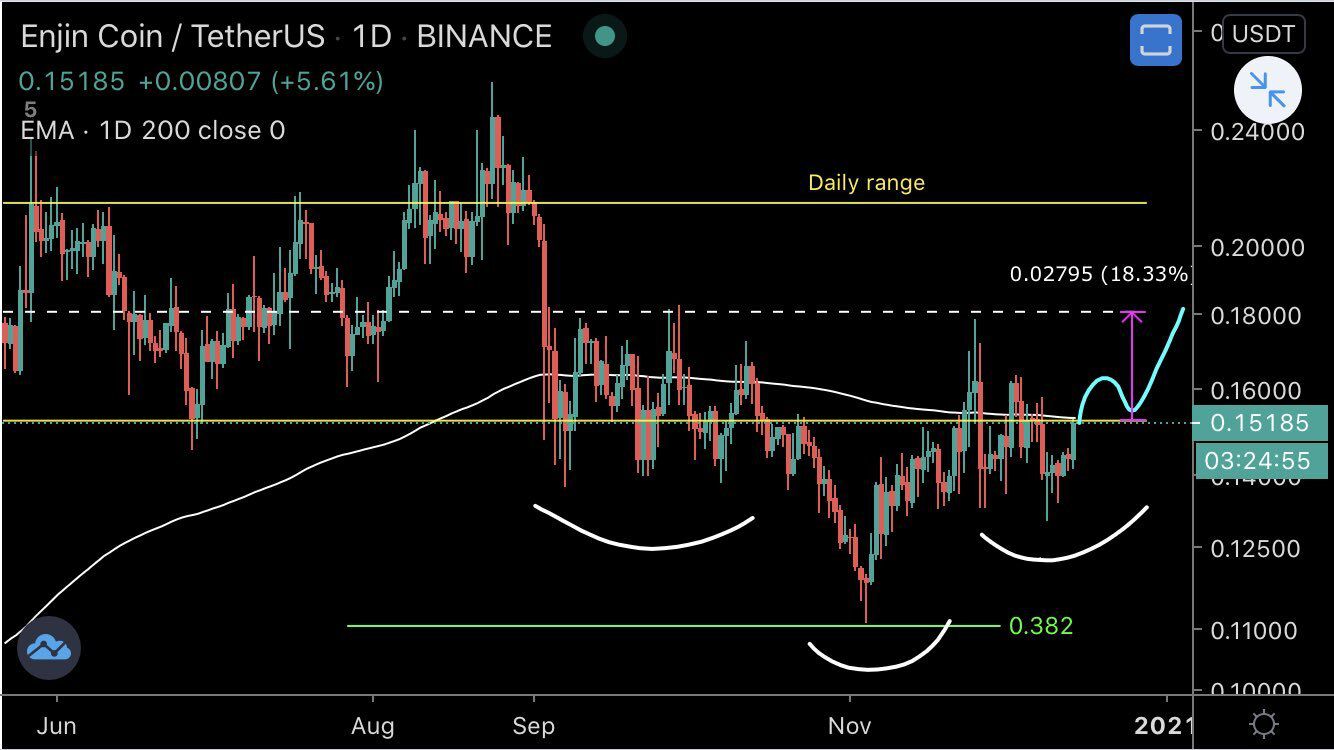
Cryptocurrency trader @Mesawine1 outlined an ENJ chart, outlining an inverse head and shoulders pattern. They state that the price could soon break out and increase towards $0.184.
While the rally seems very likely, the pattern is not immediately noticeable and is far from being textbook.
Short-Term Movement
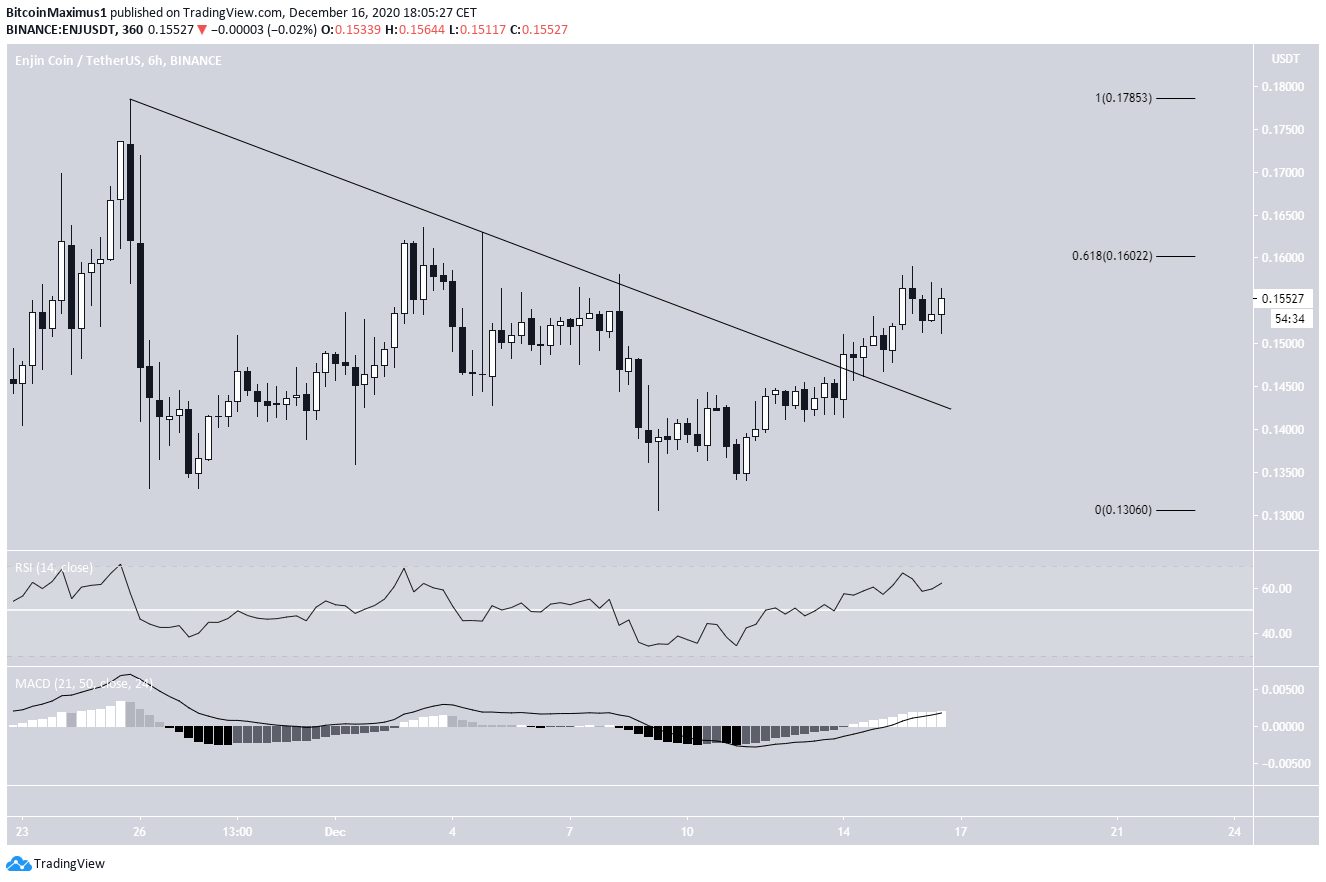
The shorter-term six-hour chart shows that ENJ has already broken out from a descending resistance line and is moving upwards.
However, it has yet to move above the 0.618 Fib retracement level, a common level for corrections to terminate. Therefore, until ENJ successfully does so, we cannot confidently determine that the trend is bullish.
However, technical indicators are bullish, supporting the possibility that ENJ will break out. This would also fit with the readings from the daily time-frame.
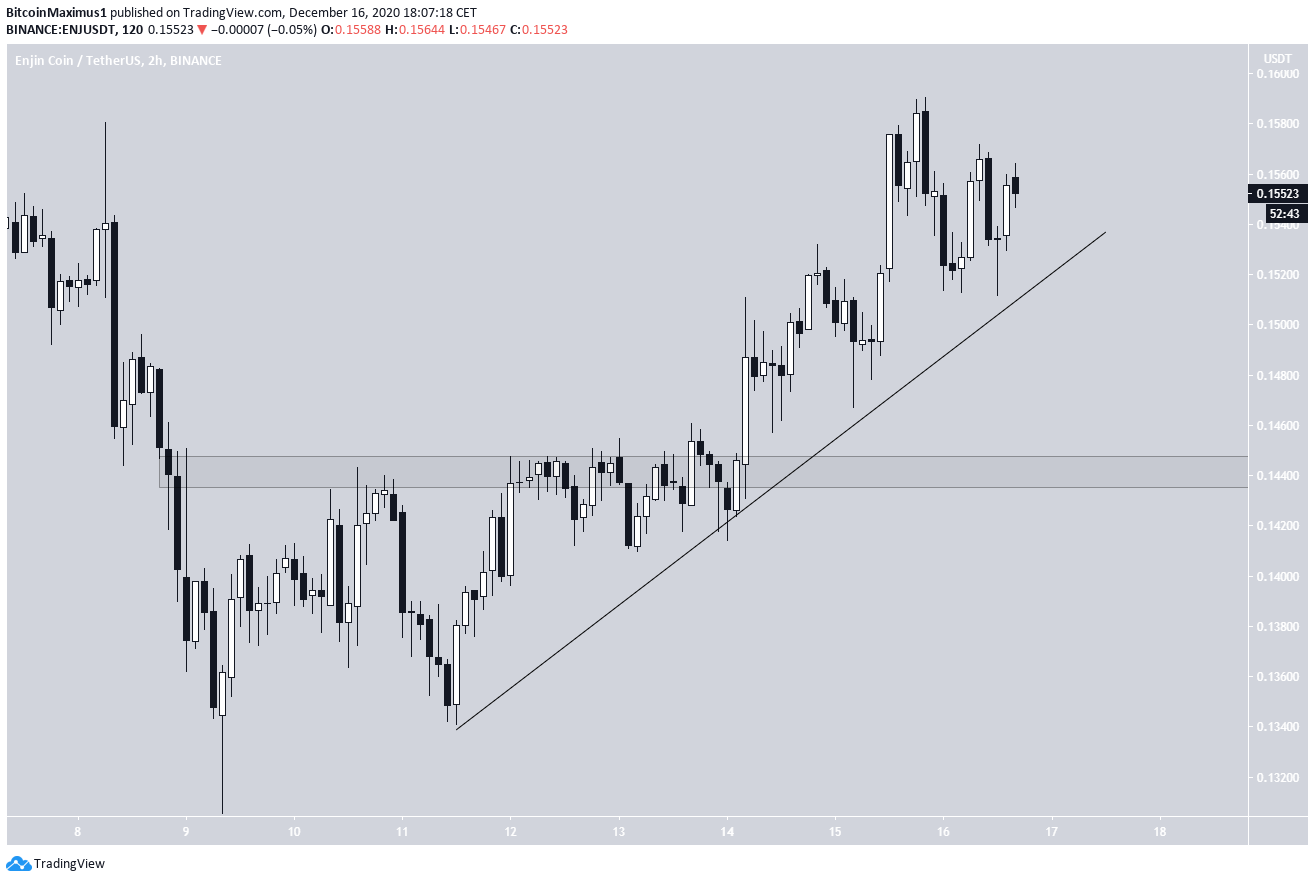
The even shorter-term two-hour chart shows that ENJ is following an ascending support line, which hasn’t been validated enough times to confirm its validity.
Nevertheless, as long as ENJ is trading above this line, we expect a continued upward move towards the $0.167 – $0.184 resistance area outlined in the first section.
Conclusion
To conclude, while ENJ is likely to move towards $0.167 – $0.184, the trend cannot be considered bullish unless ENJ successfully reclaims these levels. At the current time, we cannot confidently determine if it will do so.
Disclaimer: Cryptocurrency trading carries a high level of risk and may not be suitable for all investors. The views expressed in this article do not reflect those of BeInCrypto.