The Solana (SOL) price has broken out from a descending resistance line but was rejected by the closest resistance area.
The price is expected to create a higher low and resume its upward movement to target the overhead resistance levels.
SOL Breakout and Rejection
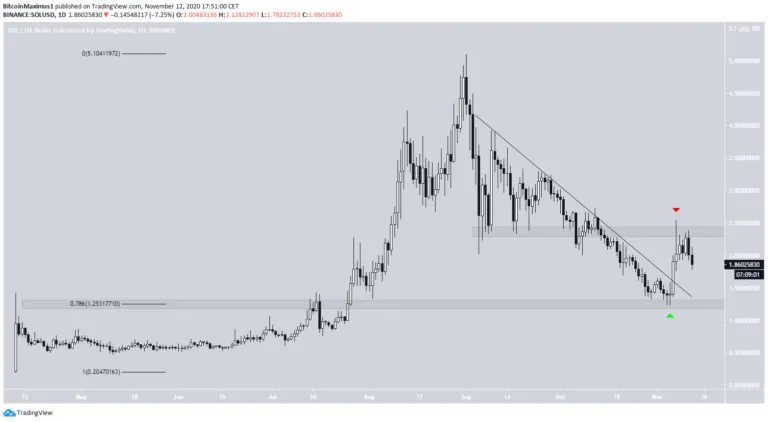
The SOL price has been following a descending resistance line since it reached a high of $5.10 on Sept 1. On Nov 5, the price reached a low of $1.22, validating the previous resistance area near $1.25 as well as the 0.786 Fib retracement level of the entire upward move.
The price bounced afterward, validating the area as support and breaking out from the aforementioned descending resistance line.
However, the breakout was short-lived. SOL was rejected by the $2.40 area, created a long upper wick, and has been decreasing since.
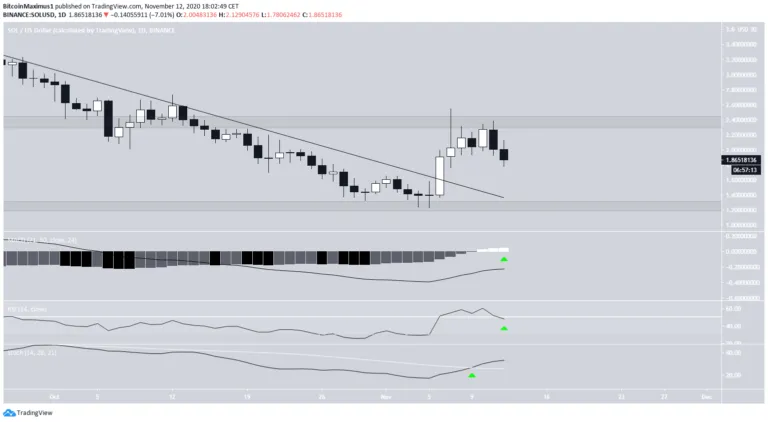
Technical indicators support the legitimacy of the breakout and continuation of the upward move:
- The MACD line is increasing and the histogram has become positive.
- The RSI has broken out above 50 and validated it as support.
- The Stochastic Oscillator has made a bullish cross.
Therefore, the breakout appears legitimate and the price is likely to increase and eventually make another attempt at moving above the $2.40 horizontal resistance area.
Future Movement
Cryptocurrency trader @altcoinsherpa outlined a SOL chart and stated that a higher low near the current price is required to maintain a bullish structure.
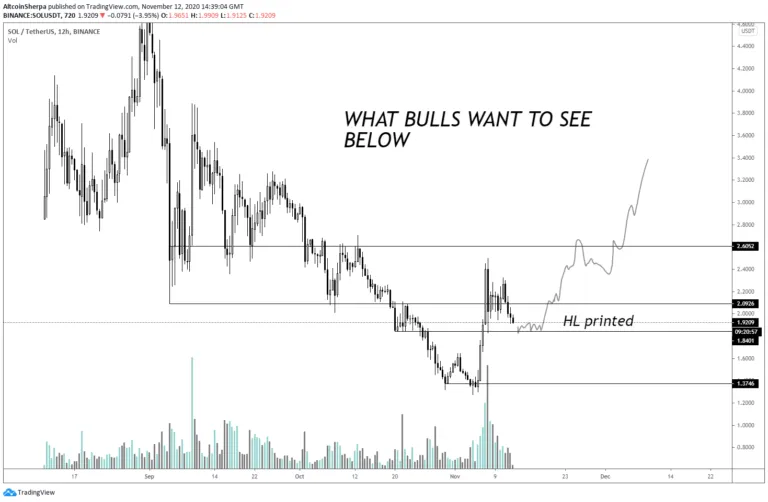
When taking a closer look, it appears likely that the price will indeed make a higher low.
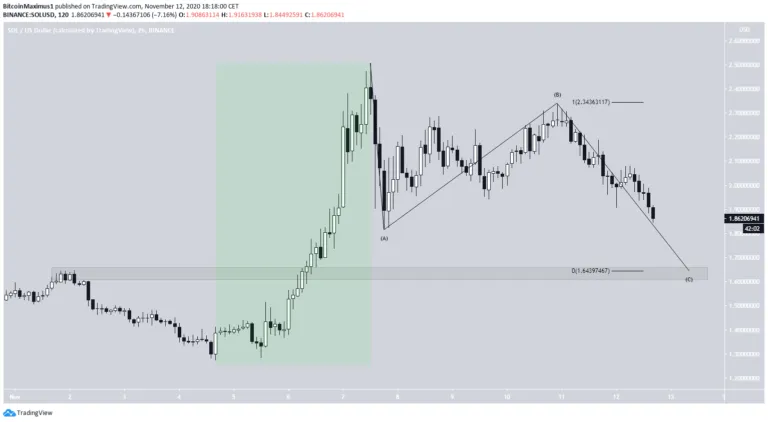
SOL has completed a bullish impulse (highlighted in green below) and is now correcting in what looks like an A-B-C corrective structure (black).
Projecting the length of wave A to C gives a target of $1.64 for the bottom, which is also a previous resistance area.
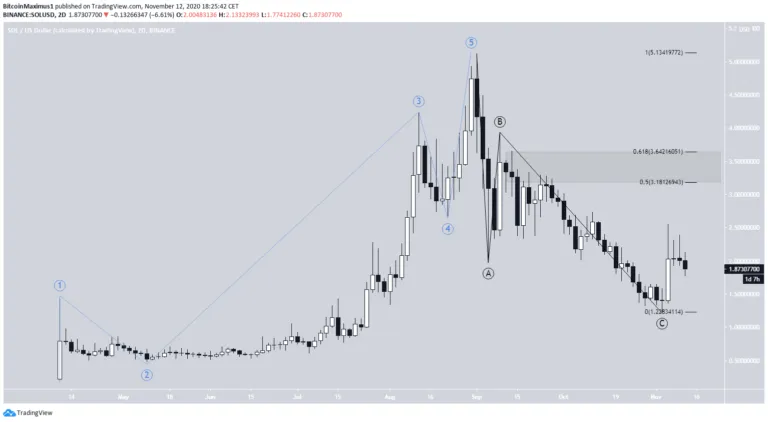
Wave Count
The wave count for SOL also suggests that the price will move upwards.
From the beginning of its price history, SOL has completed a bullish impulse (shown in blue below) and has corrected in the form of an A-B-C structure (black). The aforementioned breakout from the descending resistance line confirmed that the correction has ended.
The short-term increase also supports this possibility.
Therefore, it is likely that the price has begun a new bullish impulse which is expected to take it towards the 0.5-0.618 Fib level of the previous decrease at $3.18-$3.64.
Conclusion
To conclude, SOL seems to have completed its downward trend and is expected to gradually move upwards towards the resistance levels at $2.40 and possibly $3.18-$3.64.