The Kava.io (KAVA) price has almost reached a crucial support level, which could put an end to the decline that has been going on for more than two months.
KAVA Approaches Support
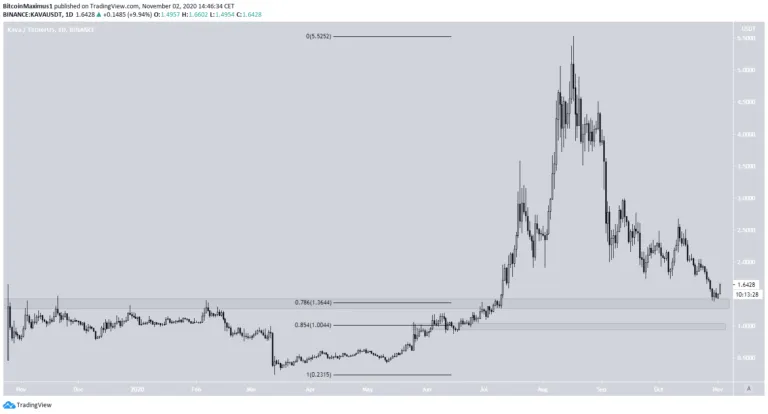
The KAVA price has been rapidly falling after reaching a high of $5.53 on Aug 17. Currently, the price is approaching the $1.36 area, which previously acted as resistance until the price broke out in July and proceeded to reach the previous high.
The $1.36 area is the 0.786 Fib level of the entire fall, and a drop below could take the price towards the next support area at $1.
Has the Price Reached a Bottom?
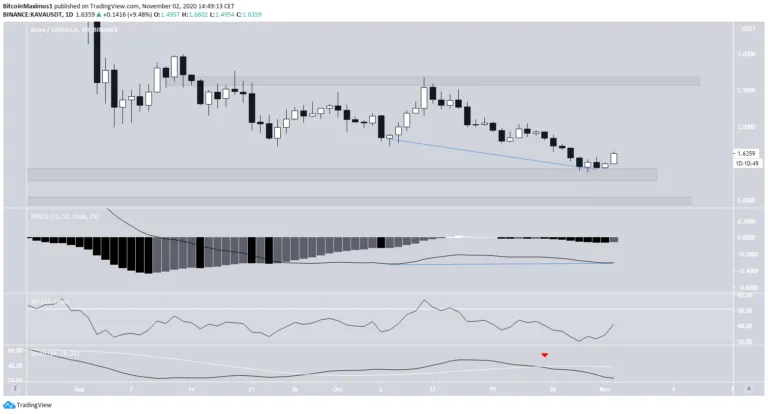
Technical indicators on the daily time-frame are bearish. The Stochastic Oscillator has made a bearish cross, the RSI is below 50, and the MACD is below 0.
However, they show that the rally is oversold and indicate the possibility of a bullish reversal since both the RSI and the MACD have begun to generate some bullish divergence. At this stage, it’s not enough to confirm a reversal.
If KAVA begins to rally, the closest resistance is found at $2.60.
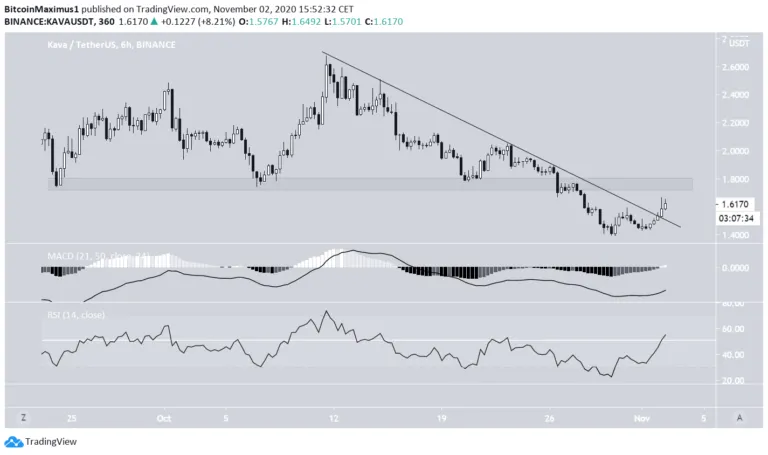
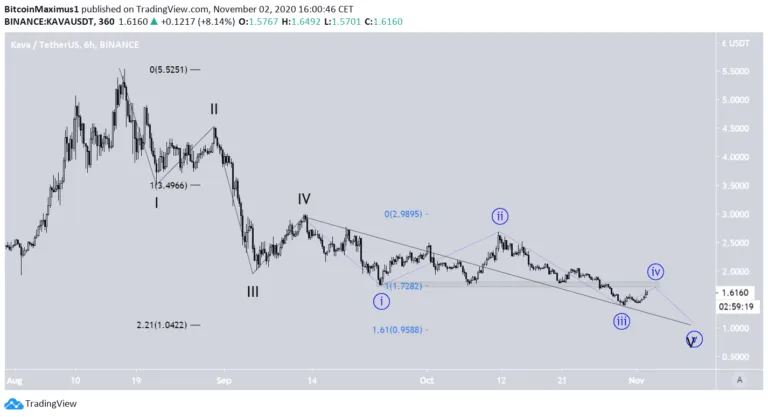
The shorter-term 6-hour chart supports this possibility since the price has already broken out from a short-term descending resistance line.
Furthermore, the MACD histogram has crossed into positive territory, and the RSI is in the process of moving above 50.
Despite this, the price has yet to reclaim the $1.80 level and is therefore not yet considered bullish. This level previously acted as support throughout Sept/Oct.
Wave Count
Cryptocurrency trader @Mesawine1 outlined a KAVA chart, stating that the price will drop once more before eventually moving higher towards $3.
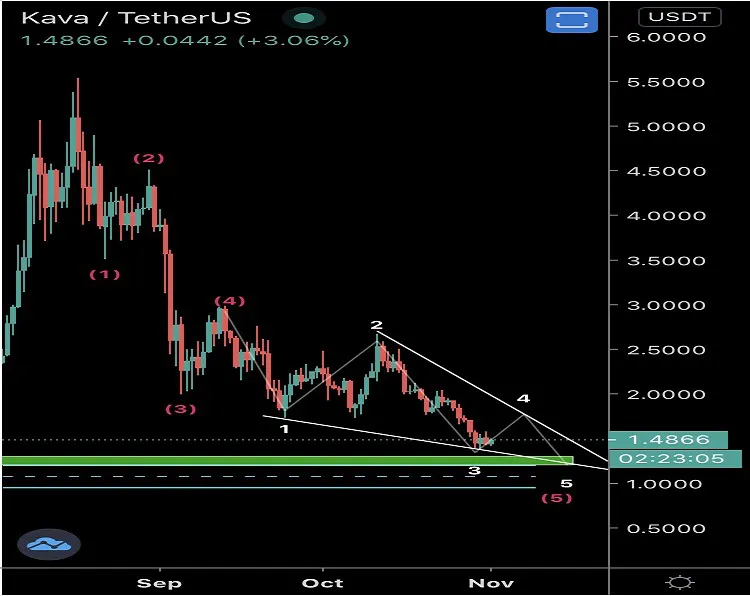
Since the previous Aug 17 high, it does seem like the price has begun a bearish impulse, currently being in wave 5 (black). If the count is correct, the price is currently in sub-wave 4 (blue), after which the final drop will occur.
Using fib extensions on both wave 1 (black) and sub-wave 1 (blue) gives some confluence near the $1 level, making it likely for it to be the bottom. Furthermore, as outlined in the first section, the $1 area is a crucial support level.
Therefore, it would make sense for the price to reach a bottom near that level before beginning an upward move.
Conclusion
To conclude, KAVA is likely nearing the end of its decline and has shown some bullish signs, but not enough to confirm that it has reversed trend. A reclaim of the $1.80 area would go a long way in suggesting the trend is now bullish.
The wave count indicates that the price will create one final low near $1 before moving upwards.
Disclaimer: Cryptocurrency trading carries a high level of risk and may not be suitable for all investors. The views expressed in this article do not reflect those of BeInCrypto.