- The Avalanche price analysis shows an uptrend.
- Resistance for AVAX is present at $88.33.
- Support is available at $85.
The Avalanche price analysis is bullish as the cryptocurrency has continued to rally high since yesterday, and the trend is the same today. The recent bullish push proved favorable for the coin value as the bullish momentum has been revived in the past few days. The price function is headed straight up for today, as the market has turned completely bullish. The bullish momentum has proved to be quite overwhelming for the bears, as the price has improved up to $86.6 high. The next resistance for AVAX/USD is present at the $88.3 level, which is quite near.
AVAX/USD 1-day price chart: Price curve heads up towards $88.6 as bulls continue to rally
The daily Avalanche price analysis confirms a strong bullish trend for the market today as the price rallied high during the past 24-hours. The buyers have been in the leading position for the past week as a continuous improvement in the AVAX/USD value was observed. The bullish price curve just reached $88.6 at the time of writing, gaining more than 17 percent value overnight because of the stronger demand from the buyers’ end. The coin also reports an increase in value by 24.6 percent over the past week as bulls ruled for most of the time.
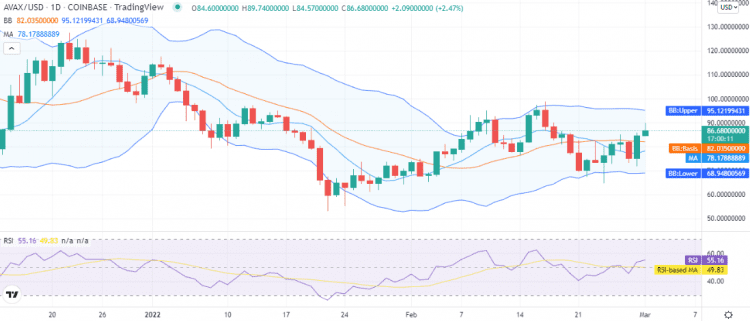
The Moving Average (MA) stands at $78.1, quite lower than the current price, as the coin price value has increased tremendously since yesterday. The volatility is high comparatively, with the upper Bollinger band present at the $95.1 mark representing the strongest resistance, whereas the lower Bollinger band is present at the $68.9 mark representing the strongest support for AVAX. The Relative Strength Index (RSI) score has improved up to index 55 as well due to the high buyers’ demand.
Avalanche price analysis: Recent developments and further technical indications
The four-hour Avalanche price analysis gives the lead to the buyers as well, as the price has been improving since the start of the trading session, following yesterday’s bullish lead. Overall, the bulls have been in the lead since yesterday, with some high spikes also recorded. The current scenario has been quite favorable for the bulls as they have cornered bears successfully. The coin value has increased up to $86.8 former high during the last four hours.
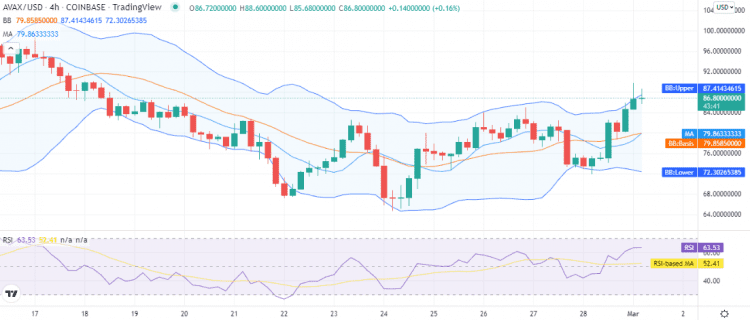
The moving average stands at a lower level, i.e., $79.8. However, the SMA 20 curve has just crossed above the SMA 50 curve because of the significant increase in price levels, which is a strong bullish indication. The Bollinger bands Indicator shows high volatility on the 4-hour chart as the Bollinger bands are expanding continuously. The upper value of the indicator is at the $87.4 mark, whereas the lower value is $72.3, the price is trading near the upper limit of the indicator. The RSI curve has taken the upwards direction and is trading near the over-bought limit at the index 63. However, the curve has flattened a bit, indicating a slow down in the buying activity.
Avalanche price analysis conclusion
The Avalanche price analysis confirms that the price has undergone a good improvement during the day. The AVAX/USD price is now touching the $86.8 mark, which is the highest of the last 10 days, and it can be expected that it will move up to further highs in the approaching hours. However, the price has reached near the resistance zone, and there are chances that the price may correct for a few hours before continuing further upside.
Disclaimer. The information provided is not trading advice. Cryptopolitan.com holds no liability for any investments made based on the information provided on this page. We strongly recommend independent research and/or consultation with a qualified professional before making any investment decisions.