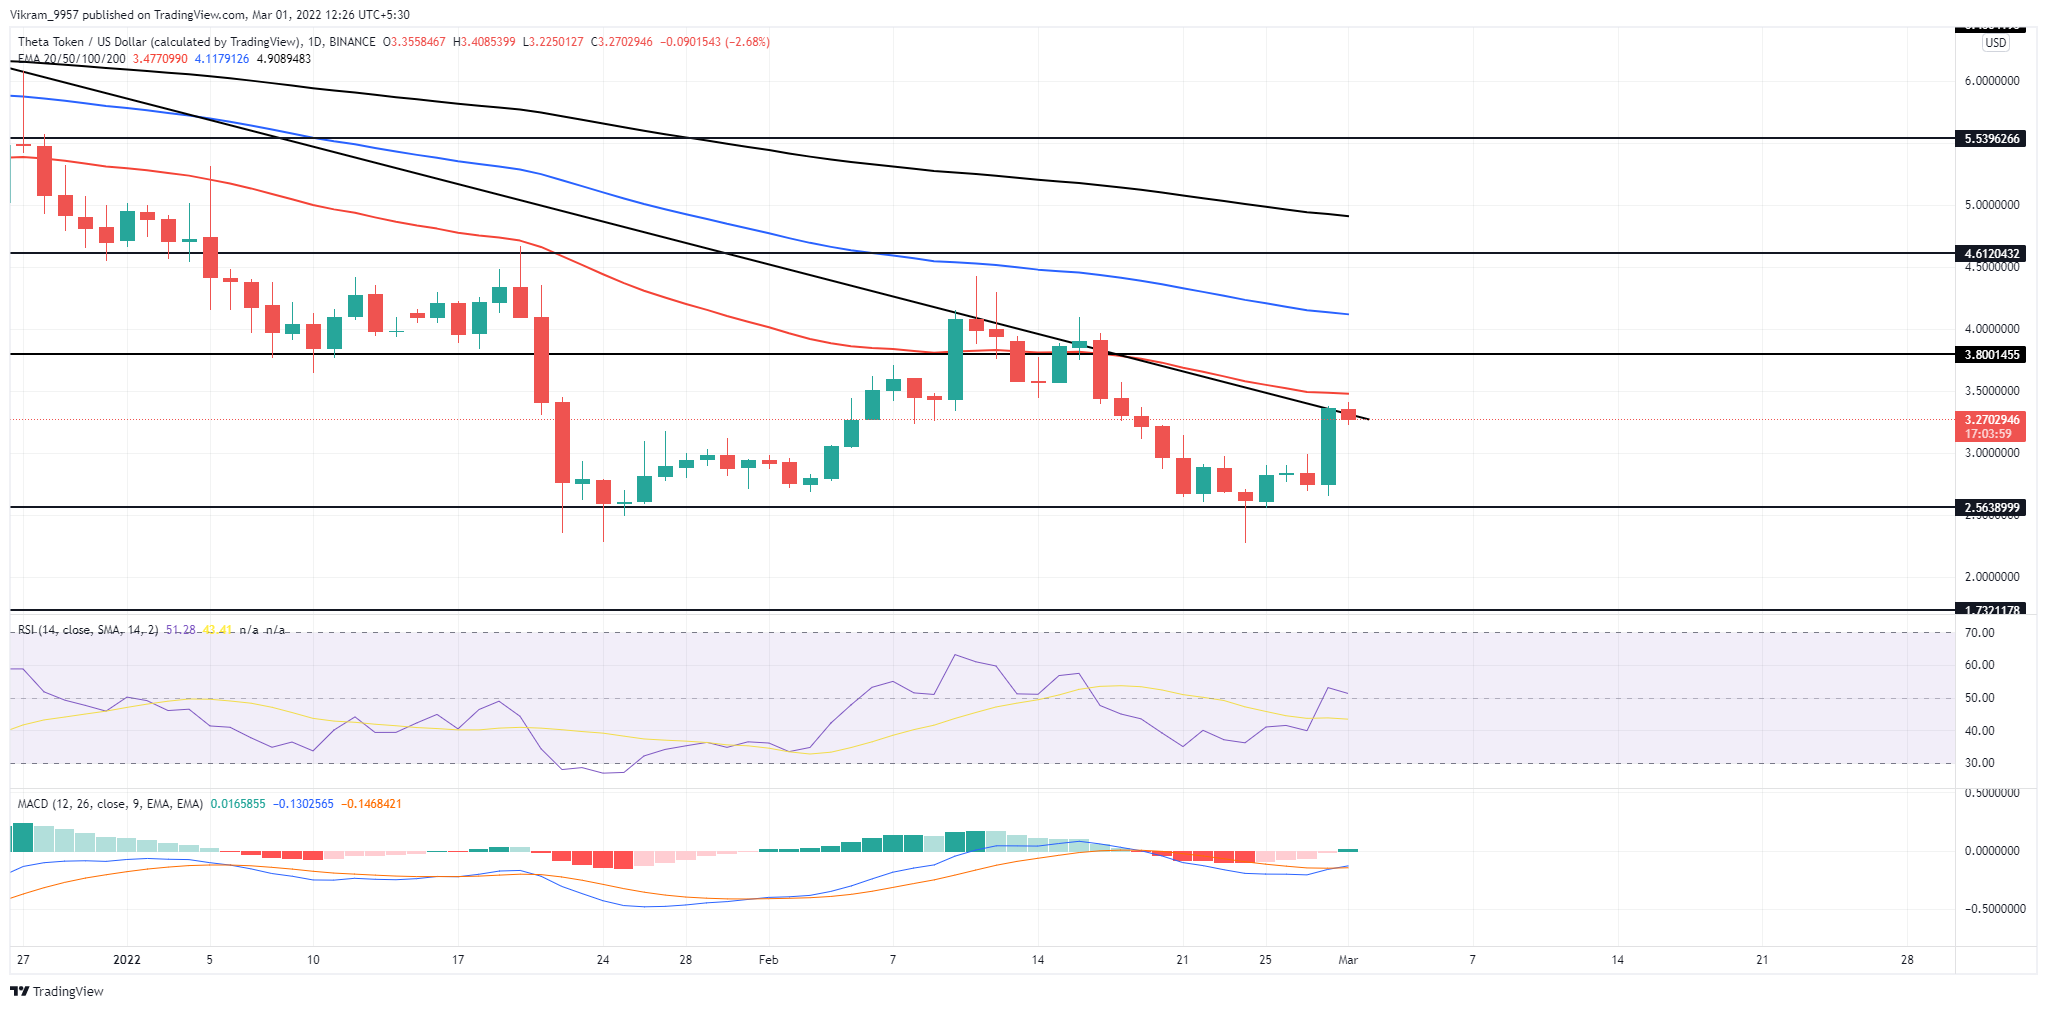
THETA coin price hints at the long coming resistance trendline breakout with the sudden surge in buying pressure in the overall crypto market.
Key technical points:
- The THETA coin approaches the resistance trendline with a 20% jump last day
- The MACD indicator shows a bullish crossover
- The 24-hour trading volume in the Theta Network’s token is $404 Million, indicating a 36% rise.
Past Performance of THETA
THETA coin price managed to halt the rejection from the 50-day EMA at $2.5, with long-tail formations indicating the bulls actively hoarding the dip. The 20% jump follows the morning star pattern, and the price approaches the resistance trendline. However, the bulls face the same psychological barrier at the 50-day EMA.  Source-Tradingview
THETA Technical Analysis
The THETA coin price shows a boom in buying pressure, with the double bottom breakout increasing the chances of the trendline breakout. Buyers can observe the rally approach the $5 mark if the prices outperform the sellers. The crucial daily EMAs in the altcoin price chart show a bearish alignment with the 50-day EMA providing a dynamic barrier along with the resistance trendline. However, the breakout of the 50-day EMA can result in a price jump to the 200-day EMA. The MACD indicator shows the fast and slow lines reverse in the negative territory to give a bullish crossover. However, the lines must enter the positive territory with a bullish growth in histograms to provide a stronger buy signal. The RSI Indicator slope spikes above the 50% line after the gradual rise in the nearly overbought zone. Moreover, the RSI slope surpasses the 14-day SMA and shows a tad bit of fall after the bullish surge. In short, the THETA technical analysis hints at a bullish continuation after the trendline breakout.
Upcoming Trend
The THETA coin price struggles near the confluence of the formidable resistance trendline and the 50-day EMA. The increased bullish pressure can result in the trendline breakout, but safe traders must wait for the price action confirmation. The breakout can result in a 40% price jump to the 200-day EMA. Support Levels: $3 and $2.5 Resistance Levels: $4 and $4.6
 cryptoknowmics.com