- Ripple price fell more than 3 percent at the start of today’s trade
- 24-hour trading volume fell 25 percent with market cap dropping 4 percent
- XRP has failed to test the $1 resistance for the third time this month
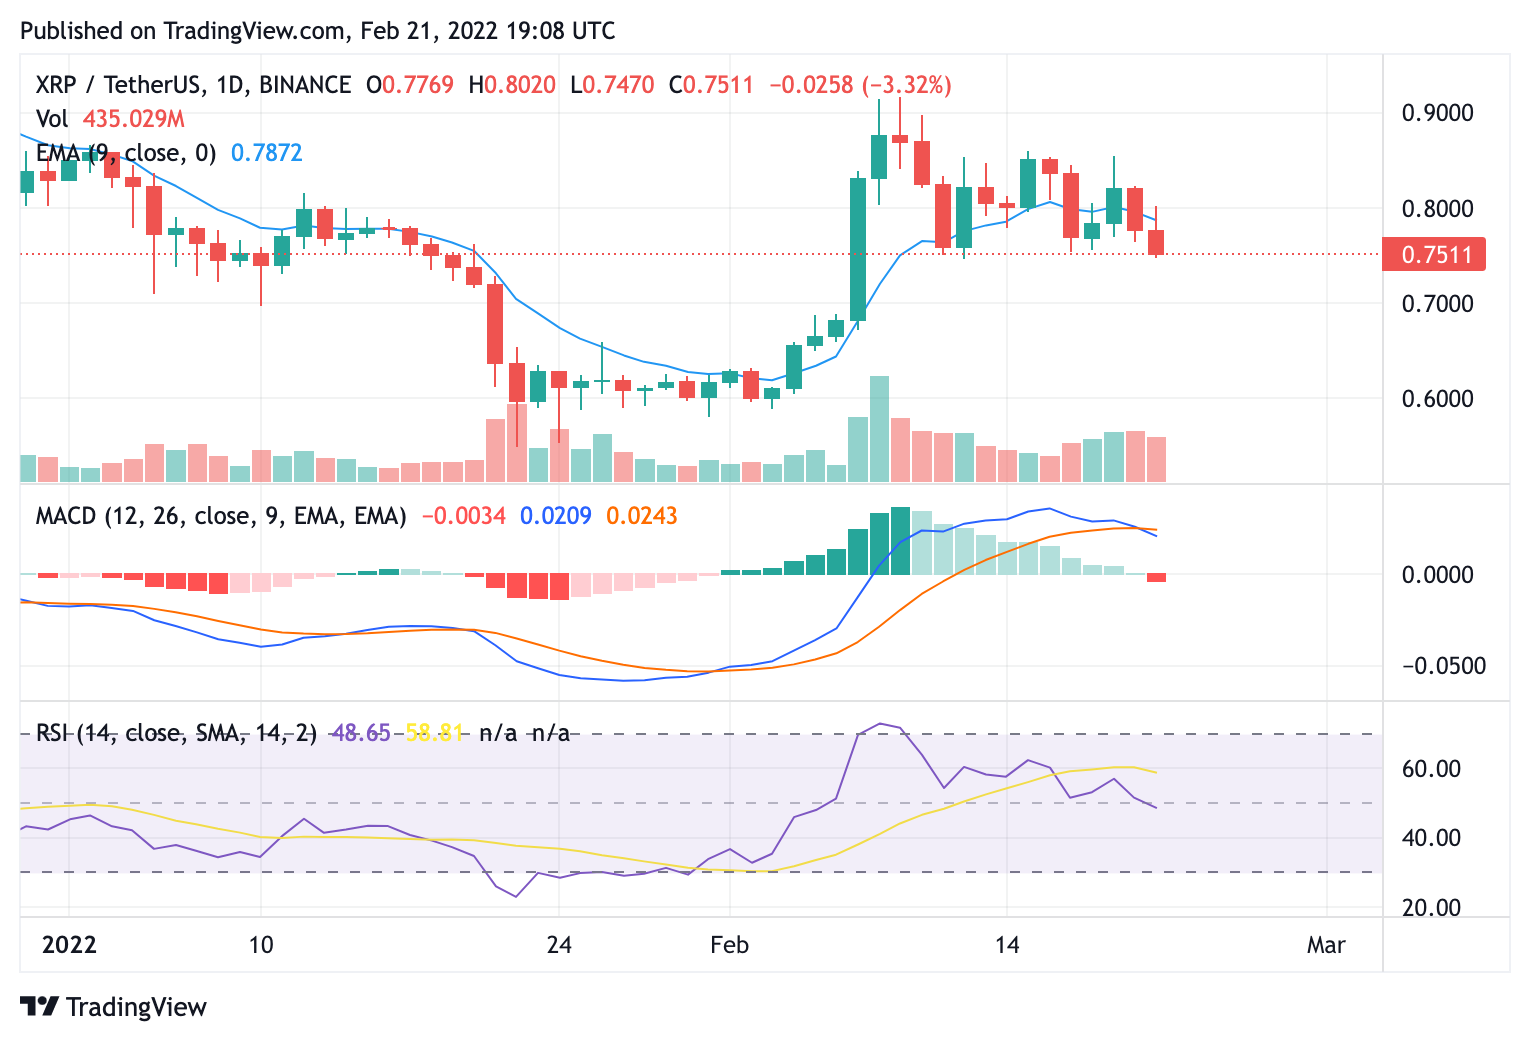
Ripple price analysis shows continued bearish signs, as price failed to consolidate up to the $1 mark yet again. After gaining more than 13 percent to move as high as $0.856, XRP derailed to as low as $0.761 and continues to decline further. Price sits well below the crucial moving averages at the time of writing and a 12-hour close below current price will indicate an official bearish breakout. Over the next 24 hours, price could retrace to as low as $0.679 to invalidate the bullish thesis.
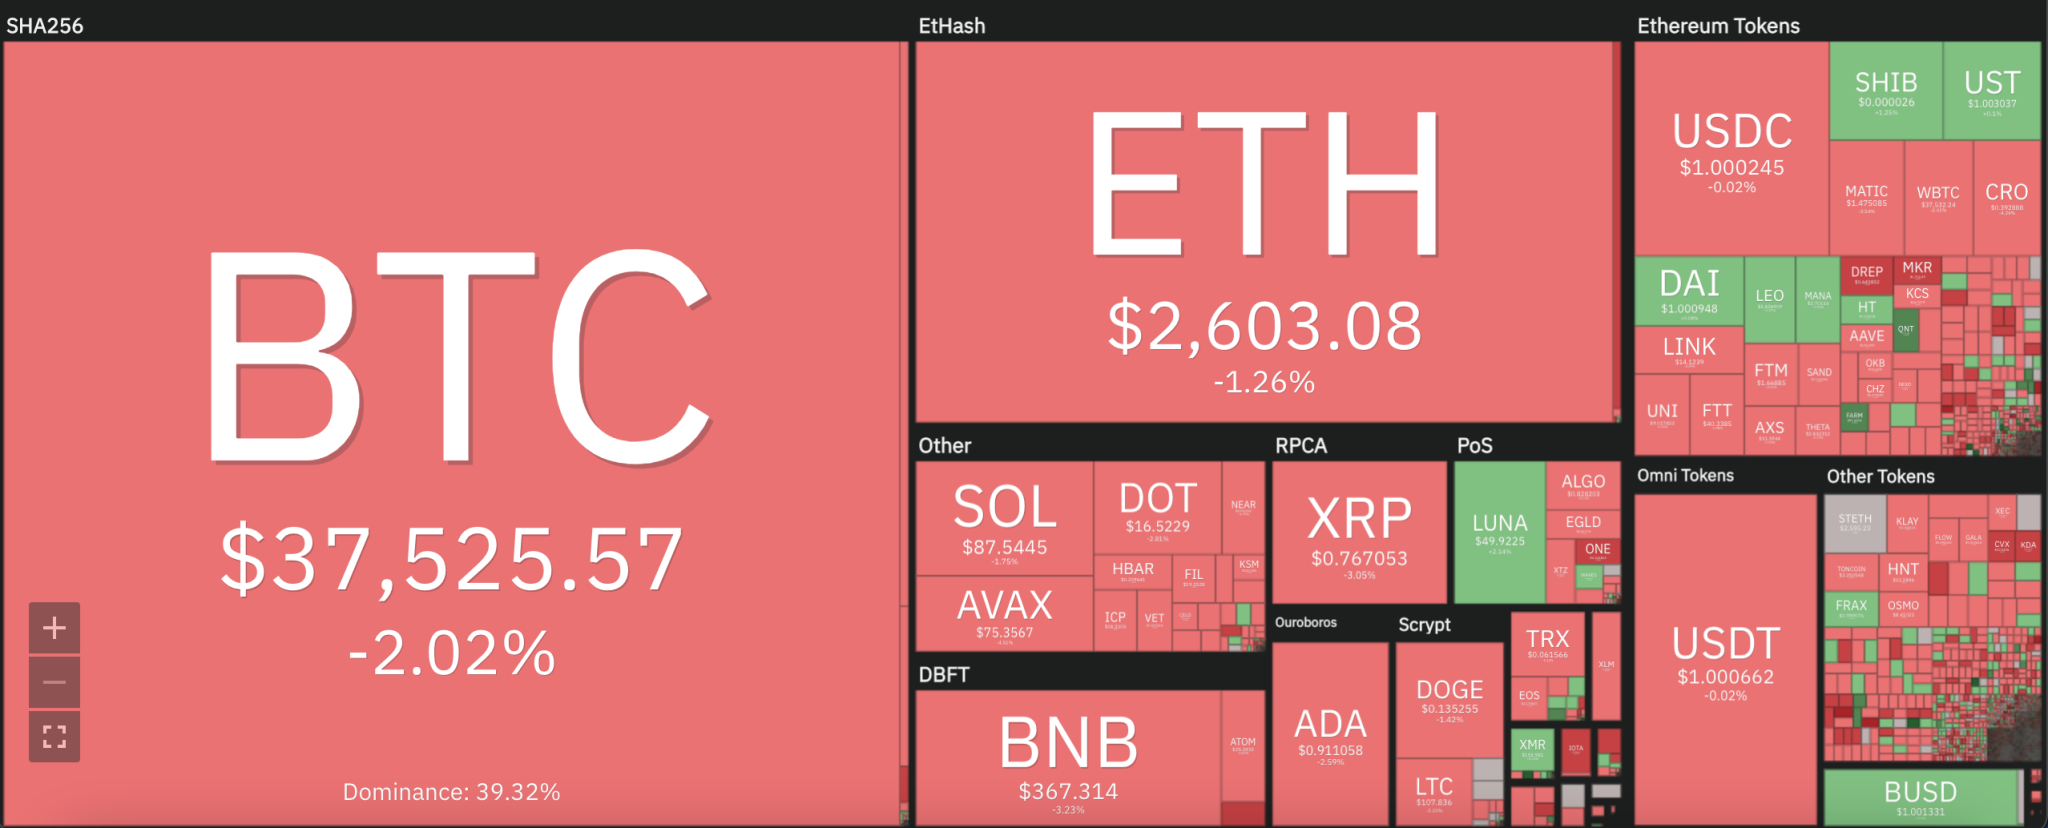
The larger cryptocurrency market started off badly to the week, as Bitcoin receded down to below $37,500. Ethereum also declined 3 percent further down to $2,600, while Altcoins also showcased losses. Cardano dropped 3 percent to $0.908, whereas Dogecoin and Litecoin went down 1.5 and 2 percent, respectively. Solana declined 2 percent to $87.538 and Polkadot 3 percent to $16.507. The only positive movement in the market was seen with Luna’s 2 percent rise up to $49.846.
Ripple price analysis: Price sets 50-day SMA target on 24-hour chart
The 24-hour candlestick chart for Ripple price analysis shows that price needs to target the 50-day simple moving average at $0.79 to form any consolidation upwards. Further retracement from this zone could spell a retest of the $0.60 mark for XRP. Resistance is set at $0.92 where profit taking may come into the market. The relative strength index (RSI) can be seen to be decreasing rapidly, but shows a promising market valuation at around 49.
XRP price has slid more than 45 percent since the start of the year, and while the late January consolidation took price as high as $0.91, the current trend has proven to be a test for the bulls. A revisit of the $0.92 resistance before further descent could be the only way for Ripple to make headway towards $1 in the current trend, which seems unlikely at present viewing.
The moving average convergence divergence (MACD) moved below its neutral zone over the day’s trade to record bearish highs, proving further detrimental evidence for an upturn in fortunes for XRP. Price currently sits well above support at $0.73, but any movement below this zone would take price towards the second support at $0.60.
Disclaimer. The information provided is not trading advice. Cryptopolitan.com holds no liability for any investments made based on the information provided on this page. We strongly recommend independent research and/or consultation with a qualified professional before making any investment decisions.