- Polkadot price jumped more than 6 percent to record its first upward movement in 9 days
- DOT jumped from $15.95 at the start of trade to sit at $18.95 at current trade
- $23.11 resistance remains as next target in sight for Polkadot
Polkadot price analysis shows a rare day of upward movement for the token, as price jumped more than 6 percent during the day’s trade. Starting from a lowly $15.95, DOT raced up to $18.95 at current trend, to target the $23.11 resistance point. Sellers had taken full control of the token since price touched the $30.22 mark on January 5, as DOT reached its 25-week low yesterday at $16.10. After today’s upward movement, price shows promise to consolidate further with the $23.11 resistance (previously support) in sight.
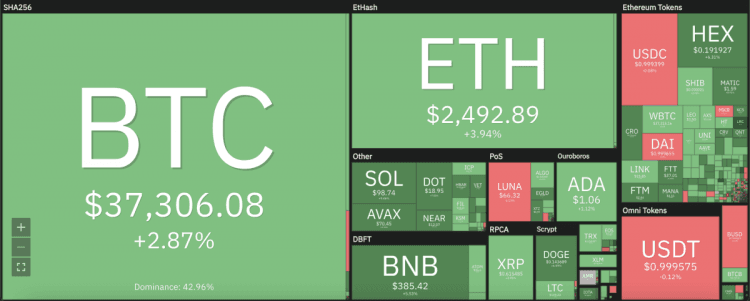
The larger cryptocurrency market showed welcome recoveries during the day’s trade, as Bitcoin ascended past $37,000 with a 3 percent rise. Ethereum recorded a 4 percent increment, sitting at $2,500, whereas Altcoins also recovered. Ripple reached $0.614 with a 3 percent increment, while Cardano rose 1 percent to reach $1.06. Dogecoin and Solana recorded the biggest increments, upping 7 and 10 percent, respectively.
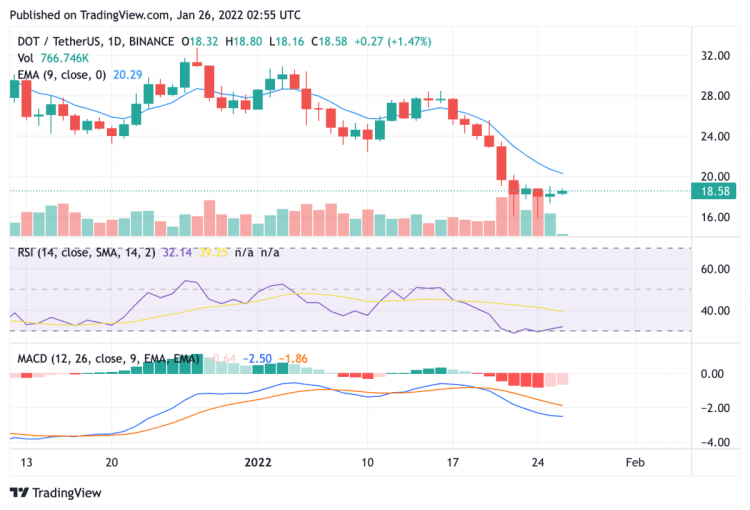
DOT/USD 24-hour chart: Crucial EMAs still afar despite positive price movement
The 24-hour candlestick chart for Polkadot price analysis shows price making ground upwards after a period of significant decline that initiated mainly on January 17. The recent progress of over 6 percent put DOT in line to test first resistance at $20 and then at $23.11. However, despite the upturn, the token still remains at a distance to the crucial 25 and 50-day exponential moving averages (EMAs) at $20.22, which must be reached to form further upward potential. The relative strength index (RSI) value has increased up to 32.58 over the past 24 hours, but still exhibits lowly market valuation for DOT. Similarly, the moving average convergence divergence (MACD) curve sits below its neutral zone and shows bearish lows.
DOT/USD 4-hour chart: Market valuation on the up but selling still the dominant trend
The 4-hour chart for the Polkadot price analysis shows an increasing RSI value of 46.73 that justifies the recent price upswing. The market valuation for DOT is on the up on the short-term trade that may put price in line to reach the $20 resistance over the next trading sessions during the day. At press time, DOT is trading at an encouraging level of $18.60. However, the dominant trend in the market tilts towards sellers, as shown by the oscillator.