- Shiba Inu price analysis is bearish today.
- Strong support at $0.00003397.
- Trading price of SHIB is $0.00002553.
Today’s Shiba Inu price analysis reveals a robust bearish movement in the market. The bulls make moves to reclaim the market, with the bears with their newfound strength, and it seems almost impossible for the bulls to counter. As a result, the price of SHIB experienced a massive decline and reached $0.00002640, from $0.00002875; on January 20, 2022, the price maintained a declining trend.
Today, on January 21, 2022, the price has been experiencing severe downs, causing the price of SHIB to decline immensely. As a result, SHIB/USD price has dropped to $0.00002553 while losing a large segment of its lost value. SHIB currently trades at $0.00002553. Shiba Inu has been up 7.83% in the last 24 hours, with a trading volume of $930,177,473.
SHIB/USD 4-hour analysis: SHIB retests support
The Shiba Inu price analysis has revealed the market following a bearish trend with the volatility opening massively, making the cryptocurrency’s price significantly more vulnerable to volatile change on either extreme. Consequently, the upper limit of the Bollinger’s band is present at $0.00002943, which acts as the strongest resistance for SHIB. Conversely, the lower limit of the Bollinger’s band is available at $0.00002588, which acts as another resistance point rather than support for SHIB.
The support and resistance bands appear to be opening, indicating the market’s colossal increasing volatility, which provides opportunities for the bulls to act up and reclaim the market; the bears control the market. Still, it seems like they have grown tired and no longer have the strength to continue. However, the bulls have been waiting for this chance. They will surely use this opportunity by regaining the lost value for the cryptocurrency; they might have plans for the market, which will be executed soon, slowly but elegantly.
The SHIB/USD price appears to be crossing under the Moving Average curve, making the market bearish. The price has entered the bearish zone with tangible signs of bullish opportunity. In the last few hours, the bears have not allowed the bulls to make moves against them and have gripped the market tightly. However, the price appears to have broken the support signifying a breakout, leading to a breakout in the market.
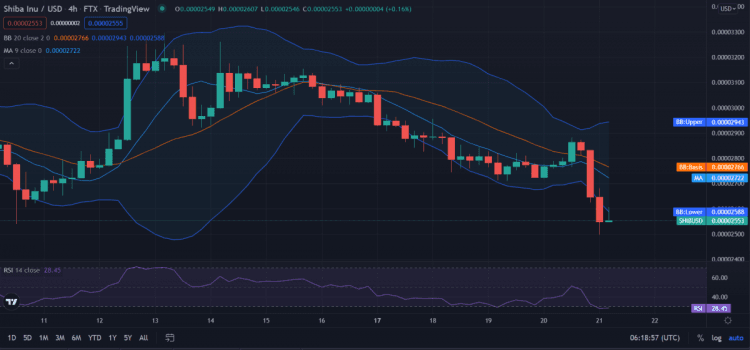
The Shiba Inu price analysis reveals that the Relative Strength Index (RSI) score is 28, making SHIB/USD fall headfirst into the undervalued region. The price has crossed the devaluation threshold and will soon regain momentum to raise the value; a reversal is imminent. The buying activity has been slightly increasing, overtaking the selling activity, causing the cryptocurrency to restore its value. However, the RSI score seems to be moving upwards, indicating movement towards stability and an increasing market.
Shiba Inu Price Analysis for 1-day: SHIB faces devaluation
The Shiba Inu price analysis has revealed a bearish market. Moreover, the market’s volatility appears to follow a dormant trend, making Shiba Inu’s price constant until the volatility fluctuates. However, the resistance and support bands have closed the gap, entering a squeeze again. As a result, the upper limit of the Bollinger’s band is present at $0.00003397, which serves as the most substantial resistance for SHIB. Conversely, the lower limit of the Bollinger’s band exists at $0.00002497, which acts as the strongest support for SHIB.
The resistance and support seem to be following a downwards biased movement together, not opening the market, but decreasing the support and resistance values, rejecting the price to break the support.
The SHIB/USD price appears to cross under the curve of the Moving Average, signifying a bearish movement. The price seems to be following a declining activity, indicating that it will soon meet the support. The support and resistance bands appear to move downwards without opening or closing the market, showing dormant behavior simultaneously. The price might break the support soon unless the volatility fluctuates; if the support breaks, the market will enter a breakout, and a possible reversal will occur.
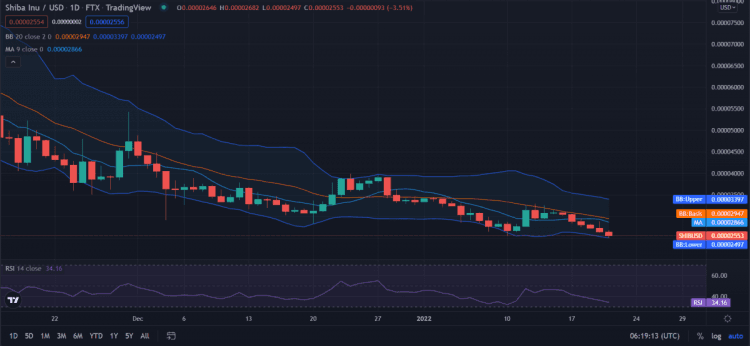
The Shiba Inu price analysis reveals the Relative Strength Index (RSI) score to be 34, signifying the depreciation of the cryptocurrency. Furthermore, the RSI falls in the undervalued region, following a downwards trend, representing the selling activity exceeding the buying activity, causing the RSI score to decrease. As a result, the score might soon fall below the threshold and further depreciate the cryptocurrency.
Shiba Inu Price Analysis Conclusion:
The Shiba Inu price analysis concludes that the cryptocurrency follows a bearish trend. However, Shiba Inu has gained bullish potential again as the market’s volatility significantly increases. Furthermore, the trend is anticipated to shift in a few days, which will raise the value for SHIB. Therefore, we can expect a bullish market in the coming days.
Disclaimer. The information provided is not trading advice. Cryptopolitan.com holds no liability for any investments made based on the information provided on this page. We strongly recommend independent research and/or consultation with a qualified professional before making any investment decisions.