- Polkadot price lowered another 3 percent during the day’s trade
- Price continues to be in constant decline since January 16 attempt to reach $30
- DOT sits on the back foot again, but presents a buying opportunity at current trend
Polkadot price analysis for the day shows its decline continuing, as price dropped as low as $23.81 over the day’s trade. Price is set to drop down to $22.36 before forming an upturn and restart towards $30. Since hitting $29.12 on January 5, DOT has been in a state of continuous decline, with bears dominating trade. However, at current trend DOT presents an opportunity for buyers to re-enter the market as an ascending trend line forms. Price is expected to make another push towards the $30 mark where the 200-day simple moving average (SMA) will create a profit taking scenario.
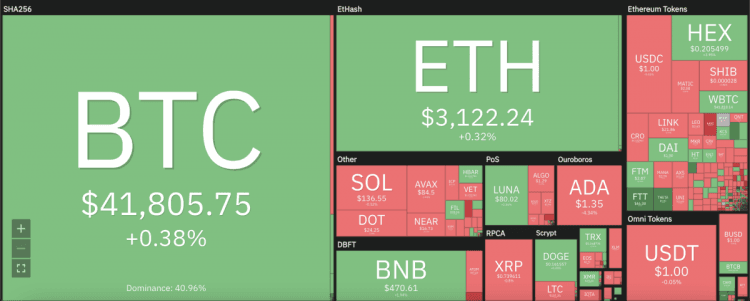
The larger cryptocurrency market continued to decline over the day’s trade, as Bitcoin lowered into the $41,000’s and Ethereum staying put just above $3,000. Among Altcoins, Cardano suffered a 4 percent decline to sit at $1.36, and Litecoin declining 2 percent down to $137.39. On the other hand, Terra continued to gain momentum, rising 2 percent to $80, along with Dogecoin rising up to $0.161.
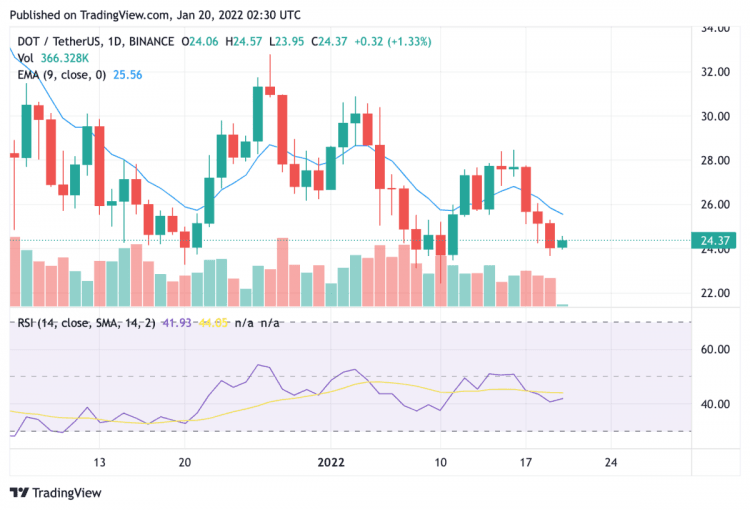
DOT/USD 24-hour chart: Decent technical indicators suggest price could go back up
On the 24-hour candlestick chart for Polkadot price analysis, price can be seen facing a series of dips since January 17 and continuing to fall over the past 24 hours. However, the current trend also looks ripe for a swift move back up once buyers can consolidate momentum. DOT will eye the crucial 25 and 50-day exponential moving average (EMA) at $25.55 before moving up towards the January high of $30.95. Resistance is expected to come in at around $29.16 with profit taking and sell offs also foreseen around this point. The current relative strength index (RSI) of 42.35 also presents a decent market valuation for DOT, presenting an ideal buying opportunity at current trend.
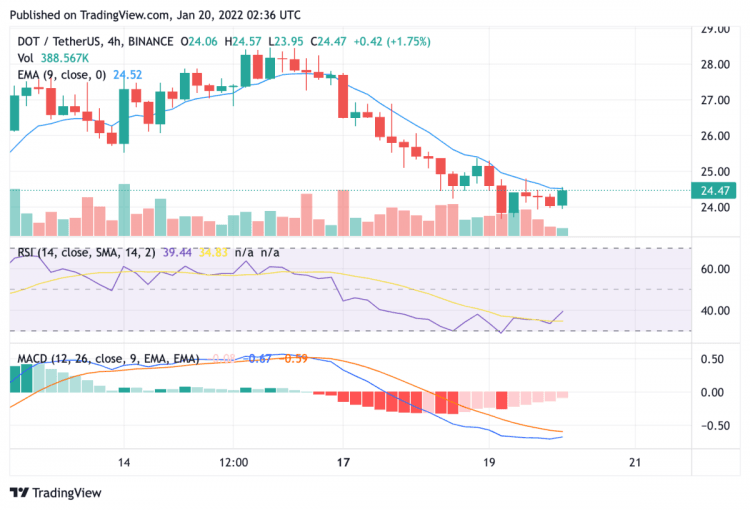
DOT/USD 4-hour chart: Crucial coming trade sessions to set tone for upturn
The 4-hour chart for Polkadot price analysis suggests that the current and upcoming short-term trading sessions are set to be crucial in consolidating buyer momentum before price falls further. After declining heavily over previous sessions, an evening star pattern can be seen that represents changing momentum for DOT. The RSI is set at 38.79 and is growing to show increasing market valuation and the moving average convergence divergence (MACD) is also expected to show bullish highs, sitting just below the neutral zone. Polkadot will target the $25 mark over the next trading sessions, with further movement north expected.