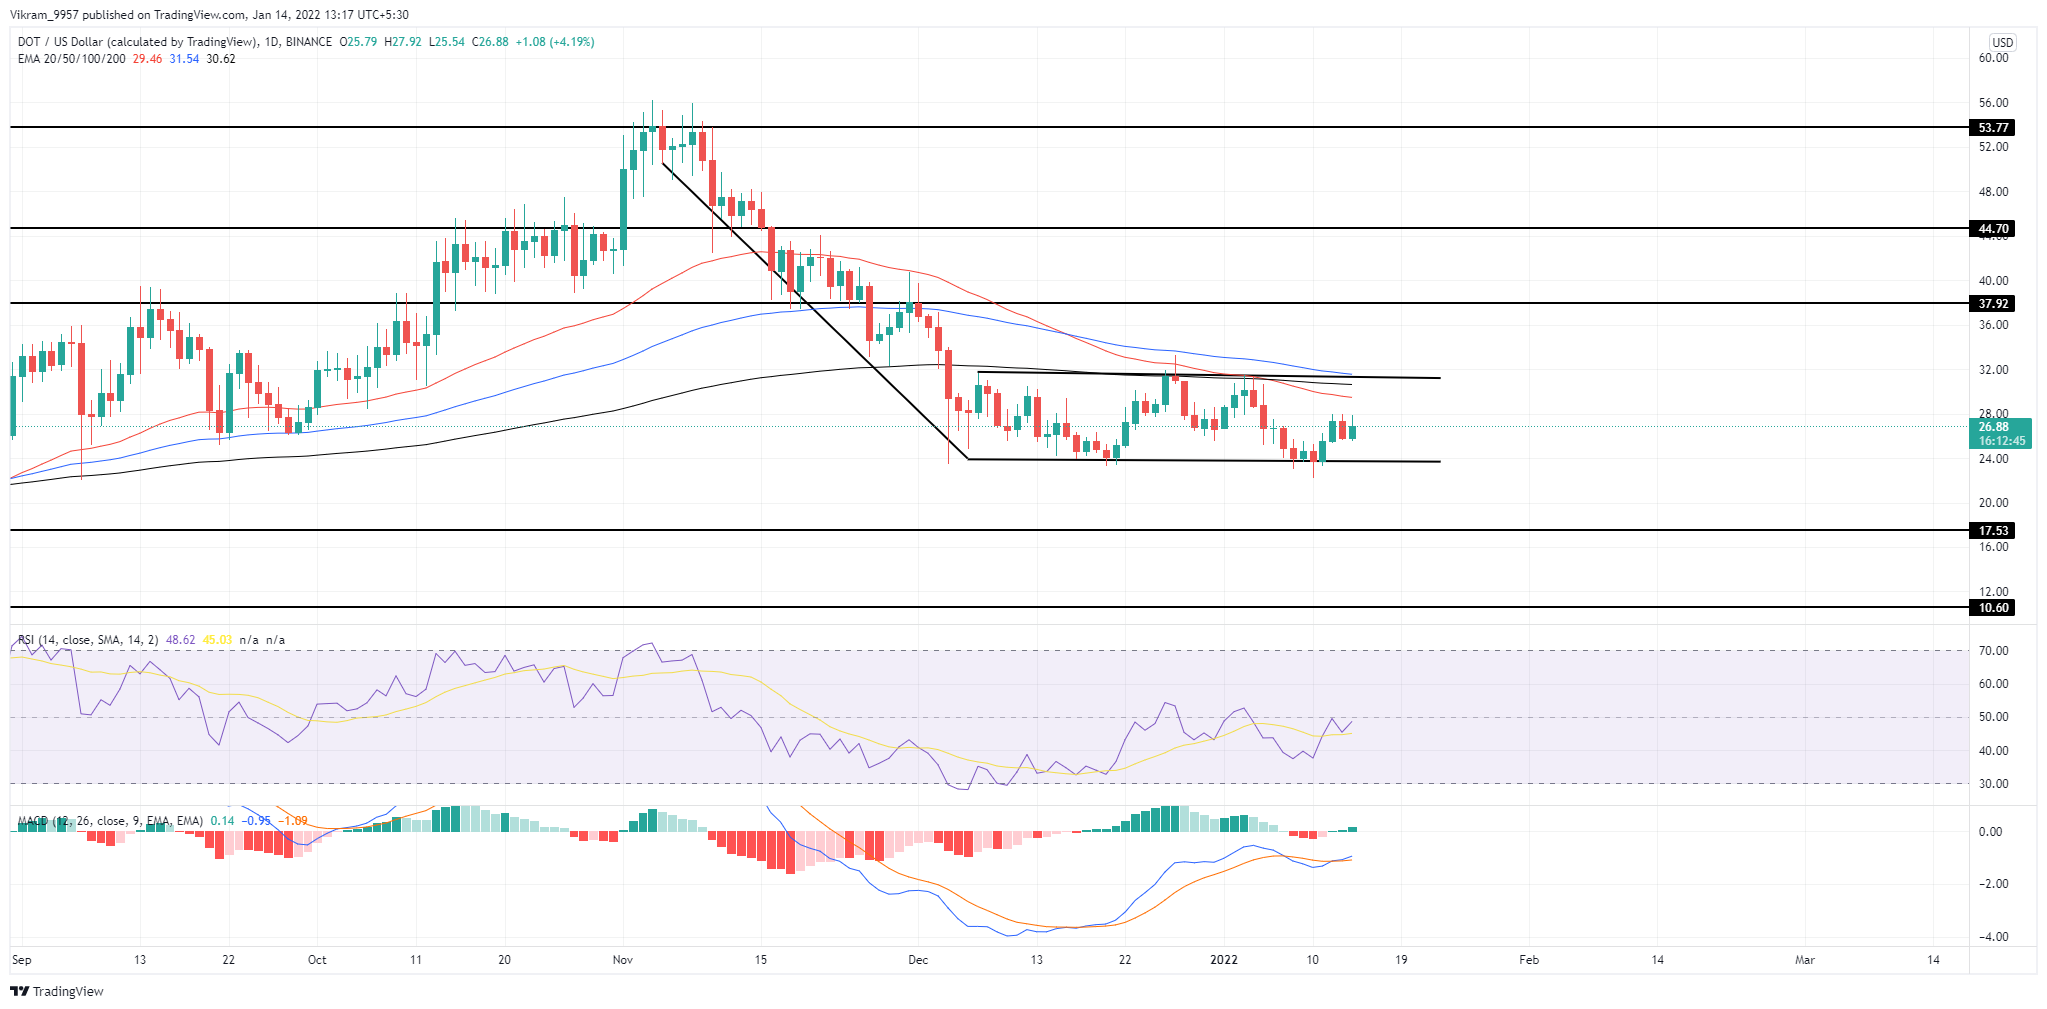
DOT coin price action shows a rise in the underlying bearishness within the inverted flag pattern teasing a fallout shortly. Polkadot is a base for a decentralized internet that is managed by its users and helps to make it easier to create new institutions, applications, and services. The Polkadot protocol allows for the connection of the private and public blockchains, without permission oracles, networks, and the latest technological advancements, making it possible for these distinct blockchains to securely exchange information and data through their Polkadot Relay Chain. Let us move ahead to read about the Polkadot technical analysis.
Past Performance of DOT
DOT coin price shows a consolidation phase in action from last month between $32 and $24 in the daily chart. The consolidation range comes after a 50% fall from the horizontal level at $54. Therefore, the price action forms an inverted head and shoulder pattern in the daily chart.  DOT/USD Daily Chart
DOT Technical Analysis
The DOT coin price resonates close to the support level of the flag pattern and indicates a bullish reversal. However, the higher price rejection within the range shows lower high formation. The crucial EMAs (50, 100, and 200) maintain a falling trend with the 50-day EMA providing dynamic resistance resulting in the higher price rejection. Therefore, the higher price rejection with falling 100-day EMA increases the chances of a bearish crossover with the 200-day EMA. The RSI indicator at 47% shows the slope struggling to rise above the 50% mark in the daily chart. However, the falling prices fail to influence the RSI slope as it shows lesser correction in comparison. Therefore, the slope presents a divergence. The MACD indicator shows the MACD and signal lines give a bullish crossover with a sudden reversal and neutralizing the previous bearish crossover. Therefore, the indicator gives a weak buy signal for the coin. In short, the technical analysis showcases the indicators giving weak buy signals, while the DOT coin price action hints at a bearish fallout.
Upcoming Trend
The breakout of the inverted flag pattern will increase the overall trend momentum in the DOT coin. Moreover, the breakout seems imminent with the higher price rejection. The price action suggests support levels at $18 and $10 can halt the bearish trend upon the breakout of $24. However, an unlikely bullish breakout will face opposition near $38 and $45. In conclusion, the consolidation phase shows a slight rise in the underlying bearishness and hints at a possible fallout. However, traders should wait for the price action confirmation before taking a short-side trade.
 cryptoknowmics.com