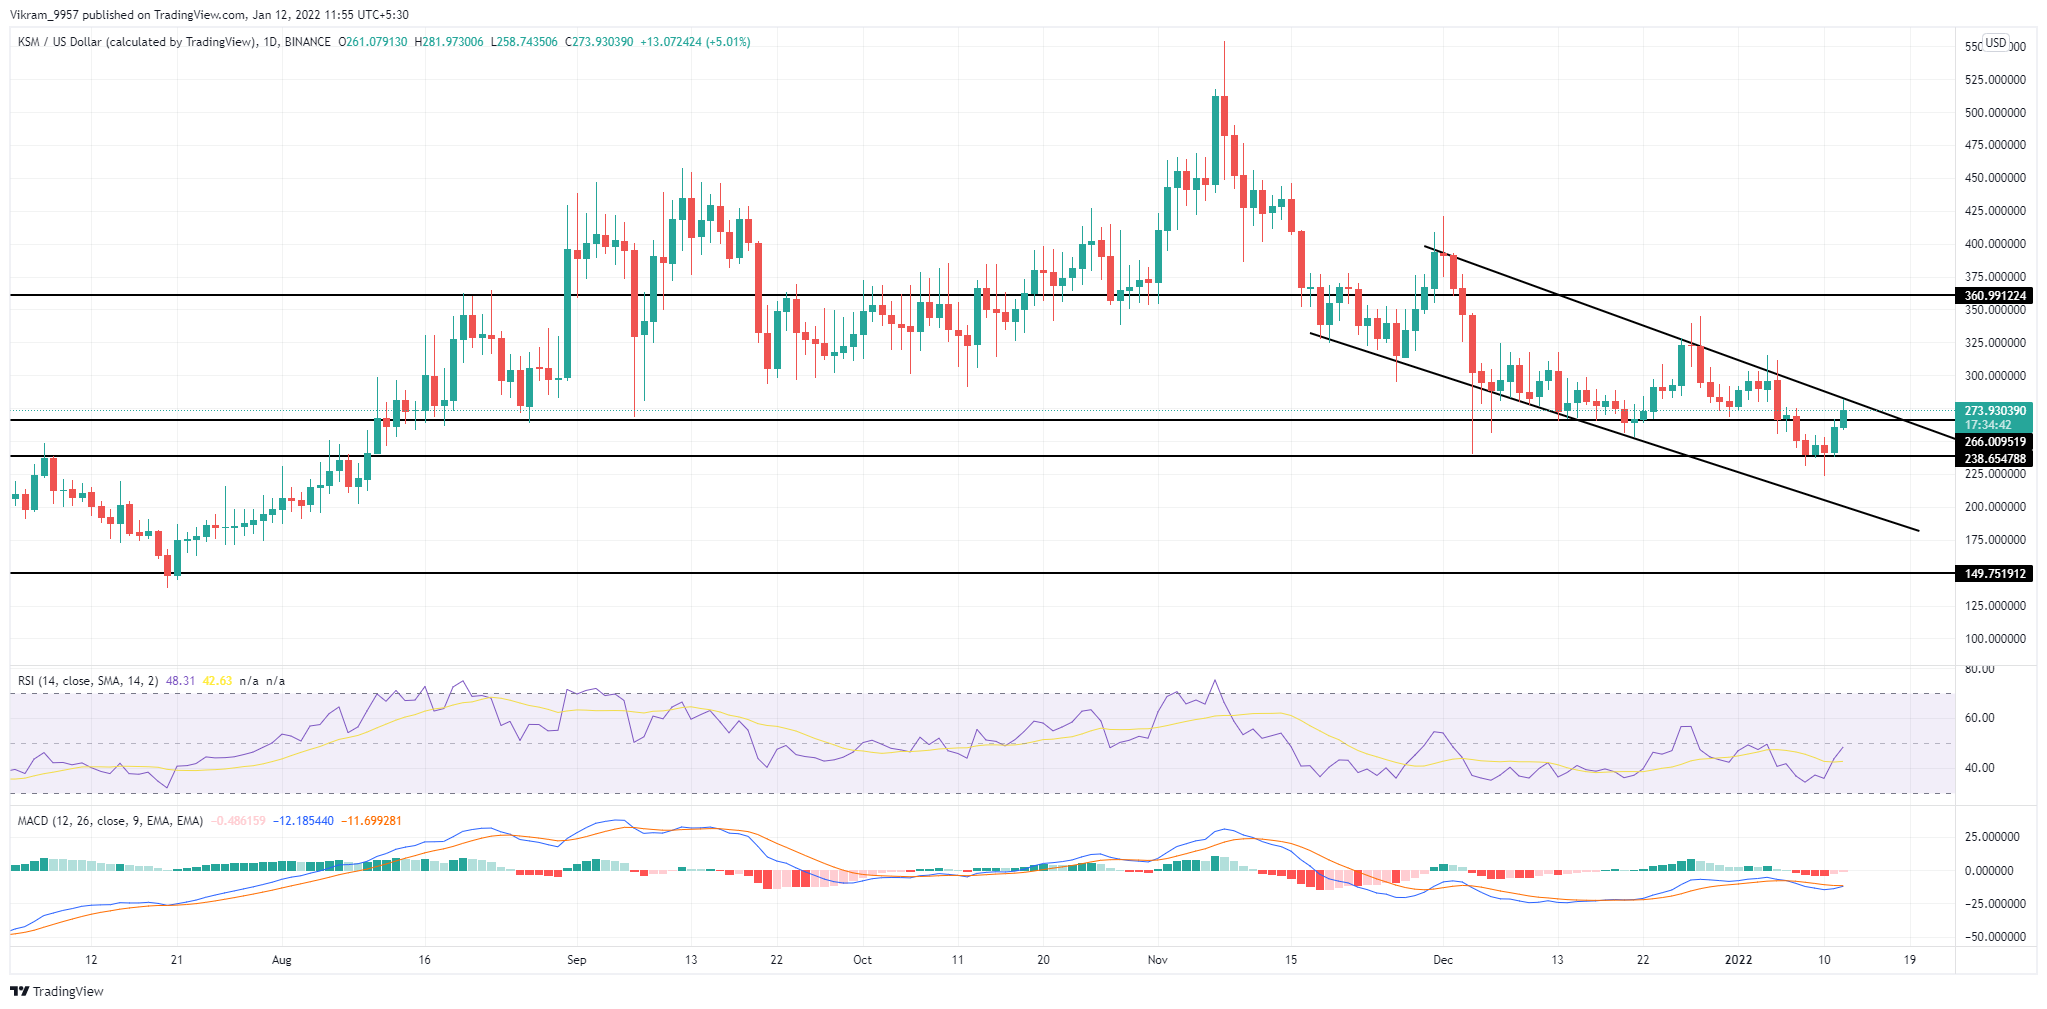
The KSM coin price gains momentum as it approaches the resistance trendline of the falling channel and increases the chances of a breakout.
Kusama is unique among blockchain platforms as it's mostly designed for developers who would like to launch bold and exciting projects, and with rapid-paced development.
It is built on a multichain, heterogeneously-sharded design that uses a nominated proof-of-stake (NPoS) consensus system. It is an alternative consensus mechanism to the energy-intensive proof-of-work (POW) scheme.
Let us move ahead to read about KSM technical analysis.
Past Performance of KSM
KSM coin price halts the downfall due to the rejection near the resistance trendline of the falling channel near $240. However, the push from $240 halts the downfall mid-way and pushes the price back to the resistance trendline. Therefore, the coin price shows a growth of more than 15% in the past 48 hours.

FTT/USD Daily Chart
KSM Technical Analysis
The KSM coin price continues the formation of bullish engulfing candles as it prepares to break above the resistance trendline. Moreover, the long-wick formations indicate lower price rejection reflecting the rise in underlying bullishness.
The crucial EMAs (50, 100, and 200) show a bearish alignment as the falling 100-day EMA shows a high possibility of a bearish crossover with 200-days EMA. Therefore, the EMAs can act as dynamic resistance for the KSM prices.
The RSI indicator at 48% rises higher towards the central line as it gives a bullish crossover with the 14-day SMA. Moreover, the 14-day SMA line shows a reversal in slope and heads higher. Therefore, the indicator shows a high chance of a bullish breakout.
The MACD indicator shows a bullish crossover of the MACD and signal lines in the daily chart after a long sideways movement below the zero line. Moreover, the falling intensity of bearish histograms shows a rise in underlying bullishness.
Upcoming Trend
The sudden rise in demand near the $240 drives the price higher to the resistance trendline and hints at a bullish breakout. Moreover, the technical indicators and the price action supports the bullish thesis.
The price action indicates resistance levels at $320 and $360 after the psychological resistance at $300. The support levels are at $260 and $240 which can halt the reversal from the trendline.
 cryptoknowmics.com