- Ripple price analysis is bearish today.
- Strong resistance is found at $1.0.
- Support for XRP is found at $0.81.
The Ripple price analysis report is bearish today. Bears have extended the decline as the price has stooped to the $0.8 range today after getting rejected at $0.96 earlier yesterday. In one instance, bulls tried to take over yesterday but were declined, and the coin kept rolling down. Today after breaking downwards and plummeting low towards $0.88, bulls have again shown up and have lifted the price back to $0.89. However, the situation looks like the bears have played the deciding shot at the start of the trading session, which may define the entire day’s progress.
XRP/USD 1-day price chart: XRP sheds another 8.2 percent, more to follow
The 1-day price chart for Ripple price analysis shows the coin has gone through a devaluation today again after being on the downslope for the last few days. The XRP/USD is trading at $0.89 at the time of writing, with clear chances for more devaluation today later on. XRP has lost around 8.2 percent value during the last 24 hours as the price function remained downwards, and the coin also lost around 5.9 percent value over the last week. The trading volume has increased by more than 29 percent, but on the other hand, the market cap has decreased by 7.02 percent.
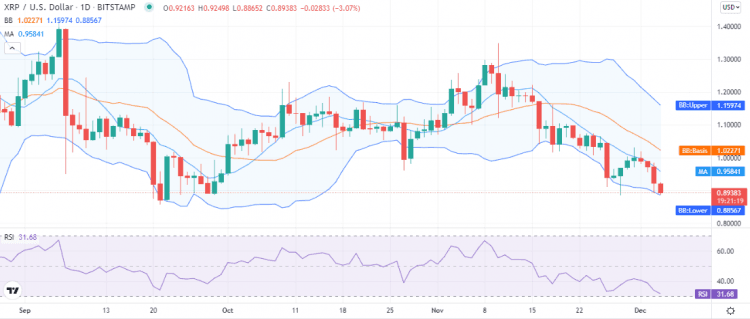
The Bollinger bands indicator shows a downwards breakout, as both the ends of the indicator are traveling downwards with a considerable gap among them, indicating high volatility. The price is trading near the lower band, which at $0.88 represents support for XRP, and the average line of the indicator at the $1.02 mark represents resistance for the coin.
The relative strength index (RSI) is on a downwards slope near the undersold region, trading at index 31. If any more selling pressure comes in, the RSI will step into the oversold region, and the chances for any recovery will diminish for long.
Ripple price analysis: Recent developments and further technical indications
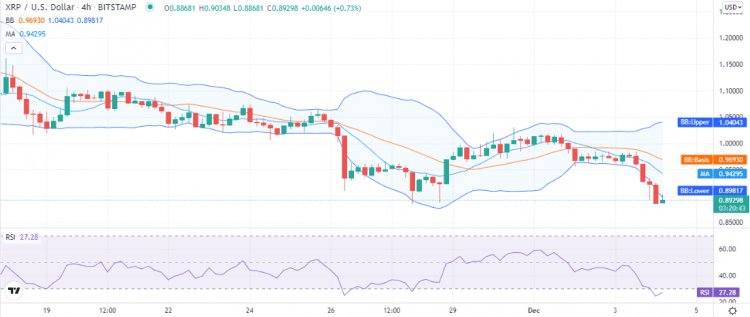
The 4-hour Ripple price analysis shows the XRP was on the decline for the last 20 hours and devalued extremely during this time, as some larger red candlestick can be seen on the chart. However, the last candlestick is green, indicating some bullish efforts. However, the recovery seems difficult at this point as the RSI has gone down into the undersold region now, and the recently forming upwards curve of the RSI may turn down again, as it is present in a largely bearish territory now and a swift revival does not seem possible.
The XRP price continues to trade below the lower band of the volatility indicator, and despite the bullish efforts, the price is still below the lower band, which at the $0.898 mark represents resistance for XRP, which is trading at $0.892 right now. The moving average (MA) still shows a value of $0.94.
Ripple price analysis: Conclusion
The Ripple price analysis report for today is not satisfactory, the coin has been rolling down the ladder since 1st December, and the RSI on the 4-hour chart indicates a dangerous situation ahead. Traders can not expect any good other than those waiting for a dip to make an entry. For intraday trading, we expect XRP to continue low in the $0.80 range; even stepping down to the $0.7 range is also possible.
Disclaimer. The information provided is not trading advice. Cryptopolitan.com holds no liability for any investments made based on the information provided on this page. We strongly recommend independent research and/or consultation with a qualified professional before making any investment decisions.